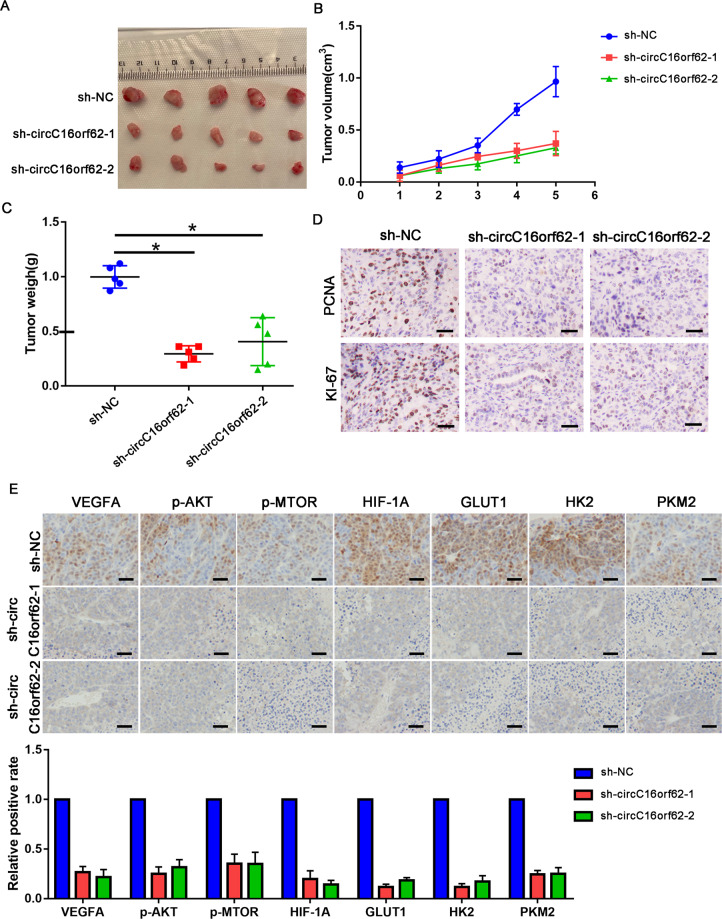
Fig. 7. Knockdown of circC16orf62 inhibited in vivo growth of HCC cell.
A The BALB/c nude mice were sacrificed for the xenografts, and the size was measured by the beside ruler. B The tumor growth curve of xenografts was plotted in shNC and shcircC16orf62 group (n = 5 each group) by measuring the tumor size (width2 × length × 0.5) with vernier caliper. C The anatomized subcutaneous tumor xenografts were weighed and analyzed with student’s t test. D IHC analysis the proliferation markers (PCNA and KI-67) in different group xenografts, the scale bar represents 100 µm. E IHC analysis the AKT/mTOR signaling pathway markers in different group xenografts, the scale bar represents 100 µm. Data are shown as the mean ± standard deviation of three independent experiments. *P < 0.05 was regarded as statistically significant.

