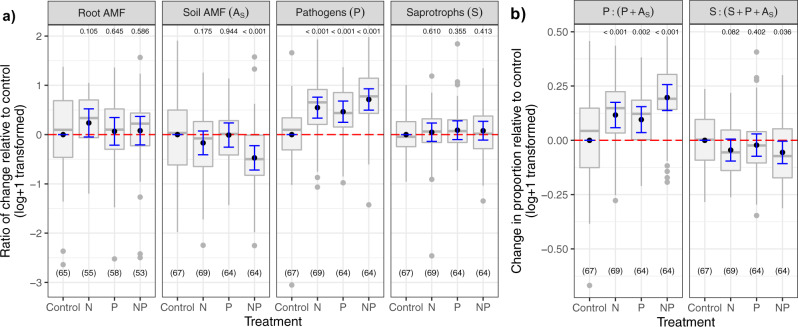
Fig. 1. Responses by fungal guilds to nitrogen (N), phosphorus (P), and N + P addition across grasslands.
a Colonization by AMF in roots based on microscopy (Root AMF), and soil abundance of AMF (Soil AMF, As), putative pathogens (P), and saprotrophs (S) based on sequence numbers in comparison to the control plots. b The P:(P + AS) quantifies shifts in pathogen to mutualist ratios, and the S:(S + P + AS) highlights shifts in the producer and decomposer food webs61 and how nutrient addition changes the relative abundance of fungi associated with living and dead plants. The black dot indicates the estimated mean effect, the blue bars the 0.95 confidence interval of the mean, while the gray bar and dots represent the boxplot and corresponding outliers of the partial residuals. Boxplots denote median value (black bar), with hinges (gray) representing the 25th and 75th percentiles, and lines extending to the 1.5× interquartile range. Numbers at the bottom indicate the number of observations included in each treatment. Numbers at the top indicate the p-value based on the two-sided t-statistic of the estimated treatment mean effect compared to the control plots.

