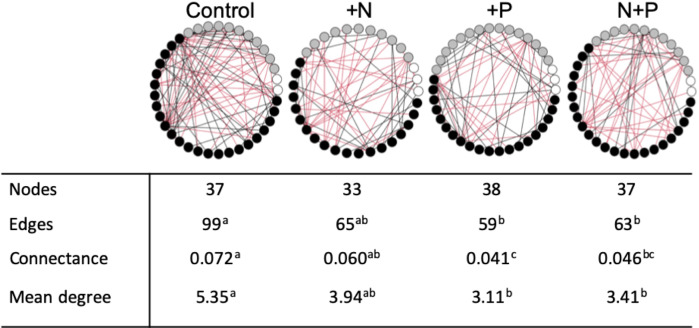
Fig. 3. Co-occurrence network analyses on fungal genera belonging to mutualists (white circles), pathogens (gray circles), and saprotrophs (black circles).
The number of nodes is the number of genera that had significant correlations with other genera, edges represent the number of significant correlations (positive indicated by black and negative indicated by red), connectance is the proportion of all possible edges that are present in each network, calculated as (number of edges)/(number of nodes)2, and mean degree is the average number of edges per node. Different superscript letters indicate statistically significant differences. All 25 sites were included in the co-occurrence analysis.

