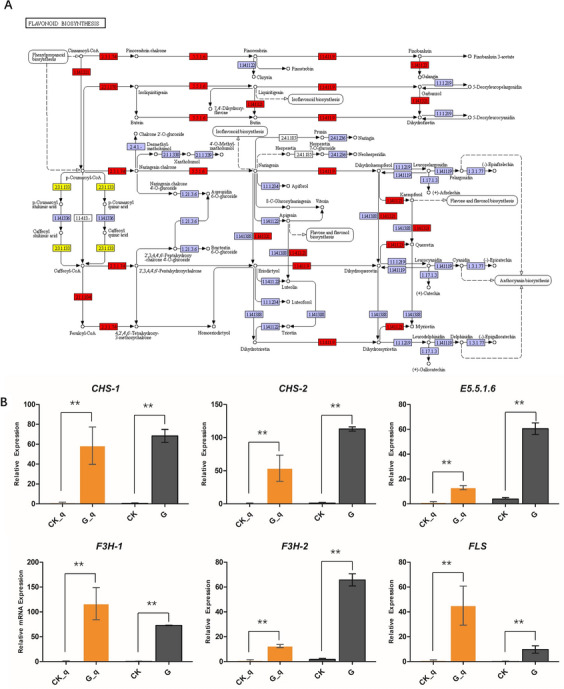
Figure 3.

The expression of DEGs enrichment in flavonoid biosynthesis (Ko00941, cited from Kanehisa laboratories) in G vs CK seeds (A), genes marked with red indicate up-regulated, yellow has both up- and down-regulated genes in germinated seeds. The expression of flavonoid biosynthesis pathway genes by qPCR determination (B), expression levels estimated using log2(fold change) for each transcript (**p < 0.01). In the histogram, CK_q and G_q represents qPCR analysis; CK and G represent the FPKM value of RNA_seq.
