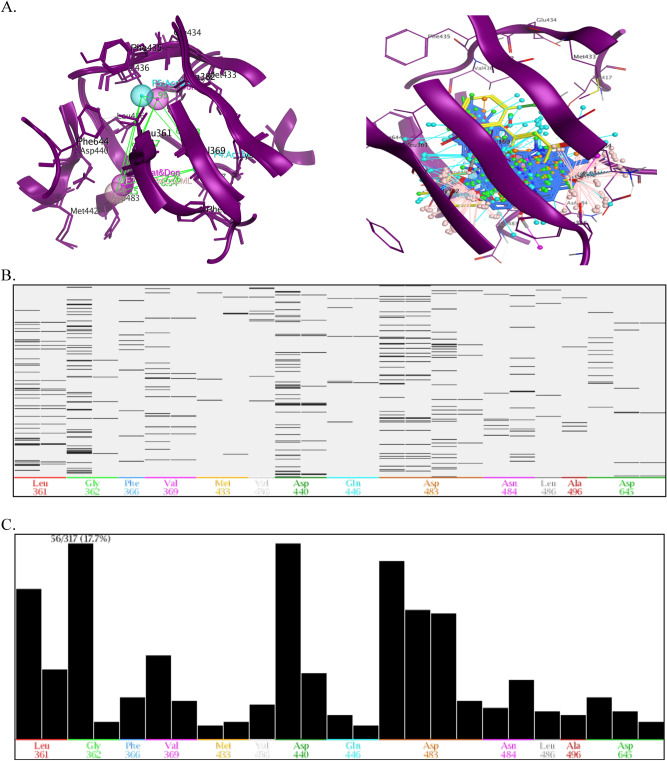
Figure 6.
. (A) The distance constraints of vital 3D pharmacophoric features were calculated and displayed in the ATP binding site of PKC-η and Overlays of virtual hits in the ATP binding site of PKC-η including vector projections. The PLIF computed the interactions between the PKC-η PKC-η -virtual, (B) The barcode representation of fingerprint of the PKC-η-ligand complexes: The x-axis displays a three-letter code of the key residues and the y-axis shows the number of PKC-η-ligand complexes, and (C) Population mode refers to the histogram of fingerprint of the virtual hits showing the number of ligands with which each residue interacts.

