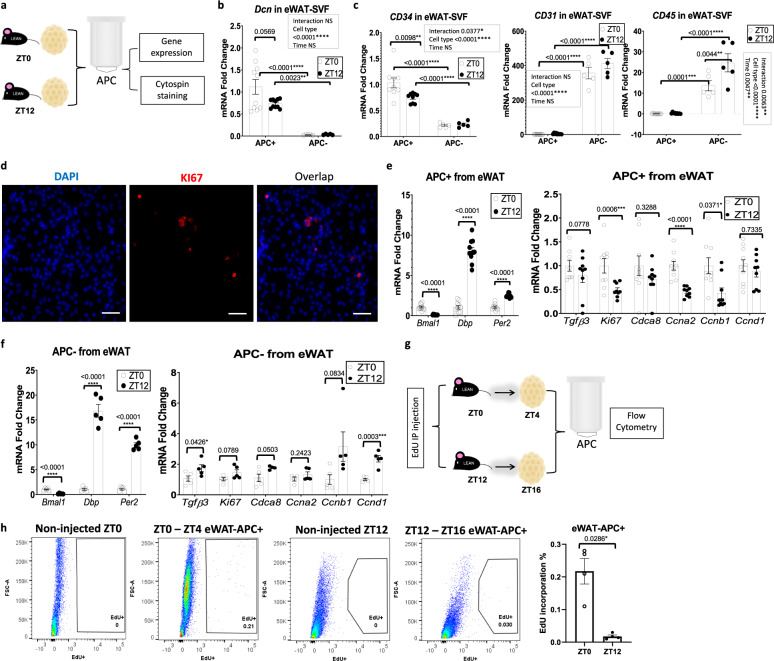
Fig. 2. Diurnal proliferation of adipocyte progenitor cells (APCs) in epididymal adipose tissue (eWAT).
a Experimental model: adipose progenitor cells (APC) within the eWAT and iWAT stromal vascular cells were isolated at ZT0 and ZT12 from lean mice fed ad libitum control chow, for further gene expression and immunostaining analysis. b, c RT-PCR analysis reveals expression of progenitor (Dcn and CD34), endothelial (CD31), and lymphocyte (CD45) markers in eWAT/APC and eWAT/non-APC cells from lean mice isolated at ZT0 and ZT12 (n = 5 animals for APC− and n = 10 animals for APC+/zeitgeber time, ZT). mRNA levels for lean mice at APC+/ZT0 were set to 1 for all genes. d Representative staining of KI67 (vs. DAPI) in eWAT-APC (scale bar = 50 µm). Staining performed once from 3 biological replicates. e, f RT-PCR analysis reveals expression of circadian (left panel) and proliferation genes (right panel) in eWAT/APC (e) and eWAT/non-APC cells (f) from lean mice isolated at ZT0 and ZT12 (n = 5 animals for APC− and n = 10 animals for APC+/ZT). mRNA levels for lean mice at APC+/ZT0 were set to 1 for all genes. g Experimental model: EdU was administered to lean mice fed ad libitum control chow at ZT0 and ZT12. eWAT and iWAT SVF were isolated from fat pads harvested 4 h following EdU injection and the subsequent adipose APC were isolated for further analysis. h Representative fluorescence activated cell sorting of EdU-positive cells in eWAT-APC isolated at ZT4 and ZT16, 4 h following a single EdU injection (left panel). Right panel: Quantification for total EdU+ APC (n = 5 animals/ZT). For all bar graphs, white and black circles represent ZT0 and ZT12, respectively. Data are represented as mean ± SEM. *p < 0.05, **p < 0.01, ***p < 0.001, ****p < 0.0001. Significance (p < 0.05) determined by two-way ANOVA and Tukey’s post-hoc test in b-c; two-tailed unpaired T-test in e-f; and two-tailed Mann–Whitney U test in h.

