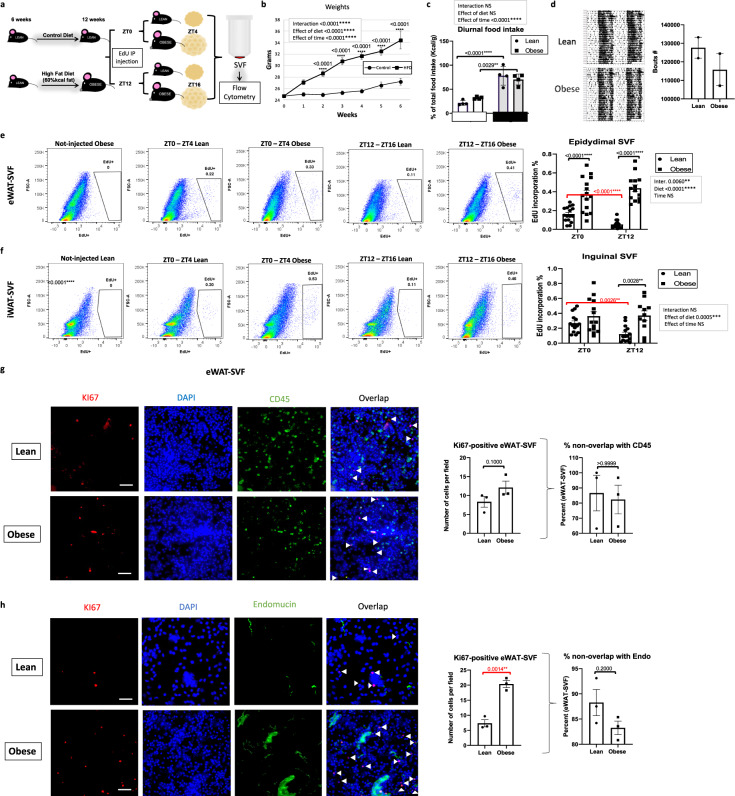
Fig. 3. High-fat feeding disrupts the diurnal pattern of adipose stromal vascular cell proliferation in vivo.
a Model of diet-induced obesity: 5-ethynyl-2ʹ-deoxyuridine (EdU) was intraperitoneally (IP) injected at zeitgeber time (ZT) 0 or ZT12 to lean mice fed control or high-fat diet (HFD) ad libitum. Epididymal fat (eWAT) and inguinal fat (iWAT)-derived stromal vascular cell fractions (SVF) were isolated from fat pads collected 4 h following EdU injection. b Weekly weight gain in chow and HFD-fed mice (n = 16 animals per diet). c Percent change in total food intake (kcal/g mouse) in light (white bar) vs. dark (gray bar) of mice fed vivarium chow or HFD ad libitum (n = 4 animals/diet and light or dark period). d Diurnal locomotion of group-housed mice as measured by infrared sensors (left panel) and corresponding quantification of bouts of activity (right panel). n = 2 cages with group-housed mice per each diet. e, f Representative fluorescence activated cell sorting of EdU-positive cells in eWAT (e) and iWAT (f) SVF (left panels) isolated at ZT4 and ZT16, 4 h following a single EdU injection, and respective quantification (right panels) (n = 16 animals/diet and ZT). g, h Representative staining of KI67 (vs. CD45)-positive cells (g) or KI67 (vs. endomucin)-positive cells (h) in eWAT-SVF (left panels) (scale bar = 50 µm) and respective quantification (right panels) (n = 3 animals/diet). t White arrows indicate the non-overlapping KI67. For all bar graphs, circles and squares represent lean and obese mice, respectively. Data are represented as mean ± SEM. *p < 0.05, **p < 0.01, ***p < 0.001, ****p < 0.0001. Significance (p < 0.05) determined by two-way ANOVA and Sidak’s post hoc test in (b) [F time(19, 2289)=237.1 / F diet(1, 2289) = 1337] or Tukey’s post hoc test in (c) [F time(1, 12) = 65.12 / F diet(1, 12) = 0.04475], (e) [F time(1, 56) = 0.4699 / F diet(1, 56) = 90.16], and (f) [F time(1, 51) = 2.271 / F diet(1, 51) = 13.86]; and two-tailed Mann–Whitney U test in (g, h). Red asterisks reveal significance determined by two-tailed unpaired t-test.

