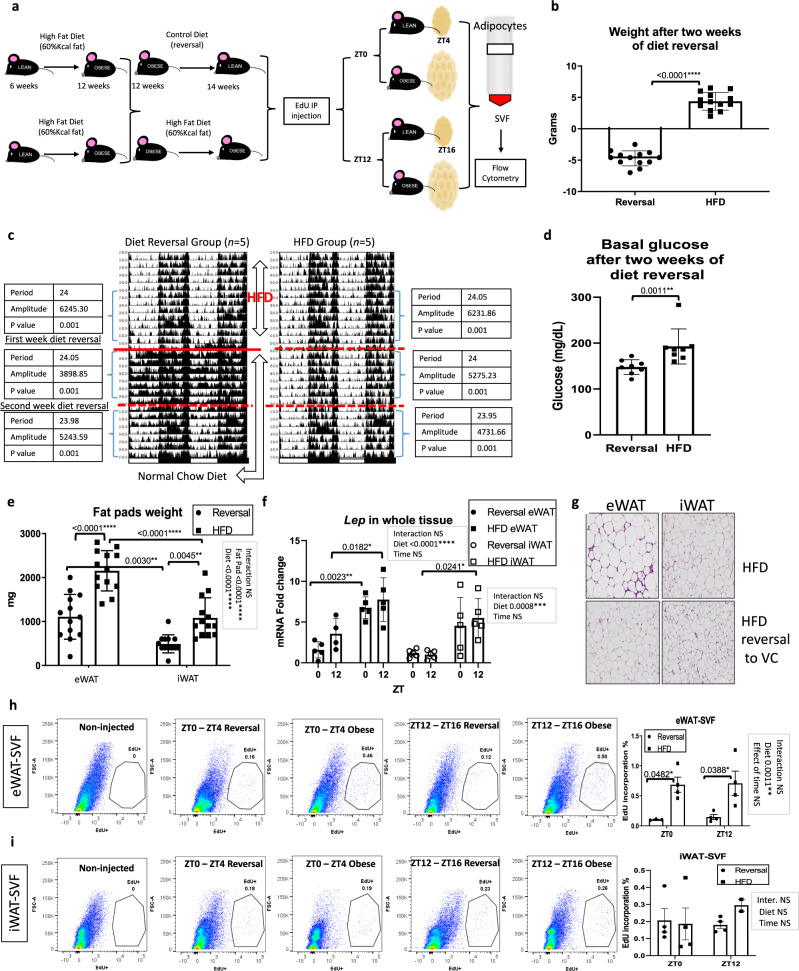
Fig. 5. Diet reversal reduces proliferation without restoring diurnal patterns of WAT stromal vascular cell proliferation in vivo.
a Experimental model: 5-ethynyl-2ʹ-deoxyuridine (EdU) was intraperitoneally (IP) injected at zeitgeber (ZT)0 or ZT12 to mice fed high-fat diet (HFD) followed by 2 weeks of chow feeding (reversal group) or continuous HFD. Whole epididymal WAT (eWAT) and inguinal WAT (iWAT), pure adipocytes, and stromal vascular cell fractions (SVF) were isolated. b Body weight of mice in each group (n = 13 animals/group). c Actograms of mice measured by infrared sensors. Straight and striped red lines indicate the start of diet reversal and elapsed weeks, respectively. Significance (p < 0.05) and parameters describing the fit determined by cosinor analysis using ClockLab software (Actimetrics). d Basal glucose of mice with or without diet reversal (n = 8 animals/group). e Weight of WAT pads with or without diet reversal (n = 13 animals/group). f qPCR reveals expression of Lep in both WAT depots with or without diet reversal at ZT4 and ZT16 (n = 5 animals/group). mRNA levels from the iWAT of diet-reversal mice at ZT4 were set to 1. g H&E staining of eWAT and iWAT with or without diet reversal (10X magnification, scale = 200 µm). Histology performed once from 3 biological replicates per condition. h, i Representative fluorescence activated cell sorting of EdU-positive SVF from eWAT (h) and iWAT (i) isolated at ZT4 and ZT16, 4 h following a single EdU injection (left panels). Quantification, right panels (n = 4 animals/group). Data are represented as mean ± SEM. *p < 0.05, **p < 0.01, ***p < 0.001, ****p < 0.0001. Significance (p < 0.05) determined by two-tailed unpaired t-test in (b); two-tailed Mann–Whitney U test in (d); two-way ANOVA followed by Tukey’s post hoc test in (e) [F fat pad(1, 48) = 51.43 / F diet(1, 48) = 48.65], (f) [F time(1, 15) = 3.080 / F diet(1, 15) = 30.68 (eWAT)] [F time(1, 16) = 0.1675 / F diet(1, 16) = 17.11 (iWAT)], (h) [F time(1, 11) = 0.06920 / F diet(1, 11) = 19.12], (i) [F time(1, 10) = 0.3203 / F diet(1, 10) = 0.4203]. For all bar graphs, black circles and squares represent mice fed chow diet reversal or HFD, respectively (white circles and squares for iWAT in (f)).

