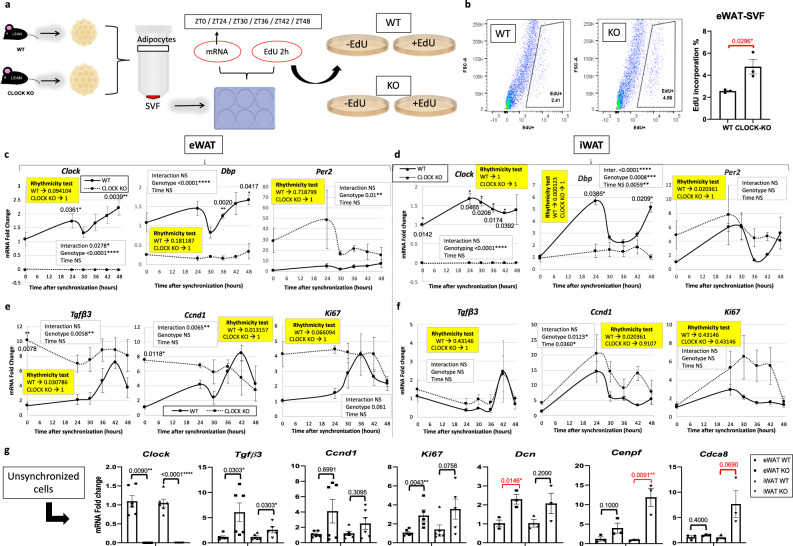
Fig. 7. Clock-deficiency results in higher levels of epidydimal fat (eWAT) stromal vascular cell fraction (SVF) proliferation in vitro.
a In vitro models of Clock deficiency: eWAT and inguinal fat (iWAT) SVF and pure adipocytes were isolated from Clock KO and WT littermate mice for further analysis (n = 3 technical replicates, from each of 2 biological replicates), and serum shocked eWAT-SVF isolated from Clock KO or WT littermates (n = 2 technical replicates, from each of 3 biological replicates) were incubated with EdU for 2 h. b Representative in vitro fluorescence activated cell sorting of EdU-positive cells from eWAT-SVF (left panels) and quantification (right panel) (n = 3 animals/genotype). c–f qPCR reveals mRNA abundance of circadian clock (c, d) and proliferation (e, f) genes in serum shocked eWAT- (c, e) and iWAT-derived (d, f) SVF from Clock KO (dashed lines) vs. WT littermates (solid lines) (representative experiment, n = 3 technical replicates). mRNA levels for WT mice at ZT0 were set to 1. Yellow boxes indicate the significance (p < 0.05) for rhythmicity test. g RT-PCR reveals mRNA abundance of Clock and proliferation genes in cultured, unsynchronized epididymal and inguinal SVF from Clock KO vs. WT littermates (n = 3 technical replicates, from each of 2 biological replicates). mRNA levels for WT mice at ZT0 were set to 1. Circles (WT) and squares (KO) represent eWAT, upward-facing triangles (WT) and downward-facing triangles (KO) represent iWAT. Data are represented as mean ± SEM. *p < 0.05, **p < 0.01, ***p < 0.001, ****p < 0.0001. Significance (p < 0.05) determined by two-tailed Mann–Whitney U test in (g); two-tailed unpaired t-test for red asterisks and two-way ANOVA and Sidak’s post hoc test in (c–f). For all bar graphs, circles and squares represent WT or CLOCK KO mice, respectively (triangles facing up or down, respectively, for iWAT in (g)).

