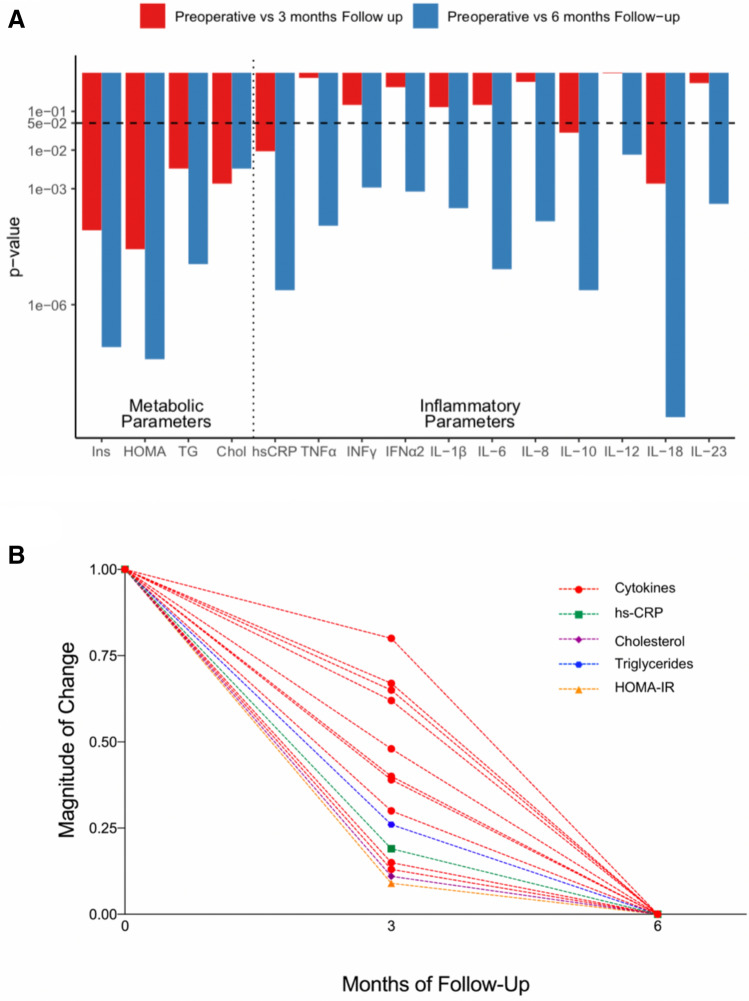
Figure 2.
Metabolic normalization precedes resolution of systemic inflammation. (A) Comparison of the p-values of the metabolic and inflammatory markers at 3 and 6 months post-surgery versus preoperatory values. The dashed line represents the cut-off for statistical significance (p-value = 0.05). (B) Median values at each time point after normalization, represented as the magnitude of change in each variable. IFN: Interferon, IL: Interleukin, TNF: Tumor Necrosis Factor. HOMA-IR: Homeostatic Model Assessment for Insulin Resistance, Chol: Total cholesterol, hs-CRP: high sensitivity C-reactive protein. This figure was made with the help of Tidyverse and Hmisc packages in R software.

