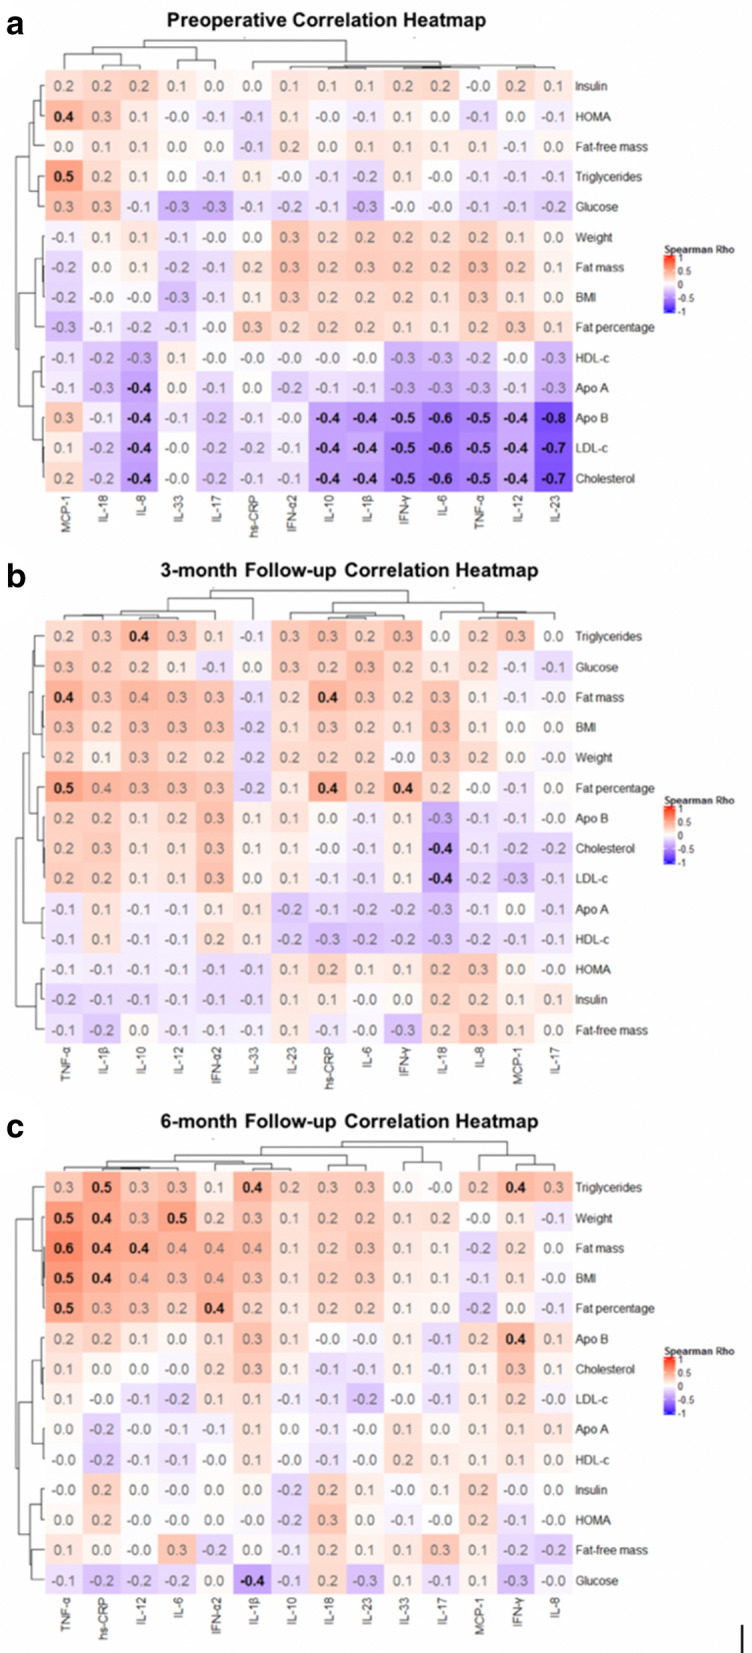
Figure 3.

Correlation heatmaps: Inflammatory markers, anthropometric indicators, body composition parameters, and biochemical variables. n = 32. Spearman’s rho rank correlation coefficient is rounded to one decimal and shown in black and bold font for statistically significant findings (p-value < 0.05). Red squares represent positive values; Blue squares represent negative values. (a) Preoperative; (b) Postoperative 3-month follow-up; (c) Postoperative 6-month follow-up. Apo: Apolipoprotein, BMI: Body Mass Index, HDL-c: High Density Lipoprotein Cholesterol, HOMA-IR: Homeostatic Model Assessment for Insulin Resistance, LDL-c: Low Density Lipoprotein Cholesterol, hs-CRP: high sensitivity C-reactive protein, IFN: Interferon, IL: Interleukin, MCP: Monocyte Chemoattractant Protein, TNF: Tumor Necrosis Factor. This figure was made with the help of Complex Heatmaps Package in R software.
