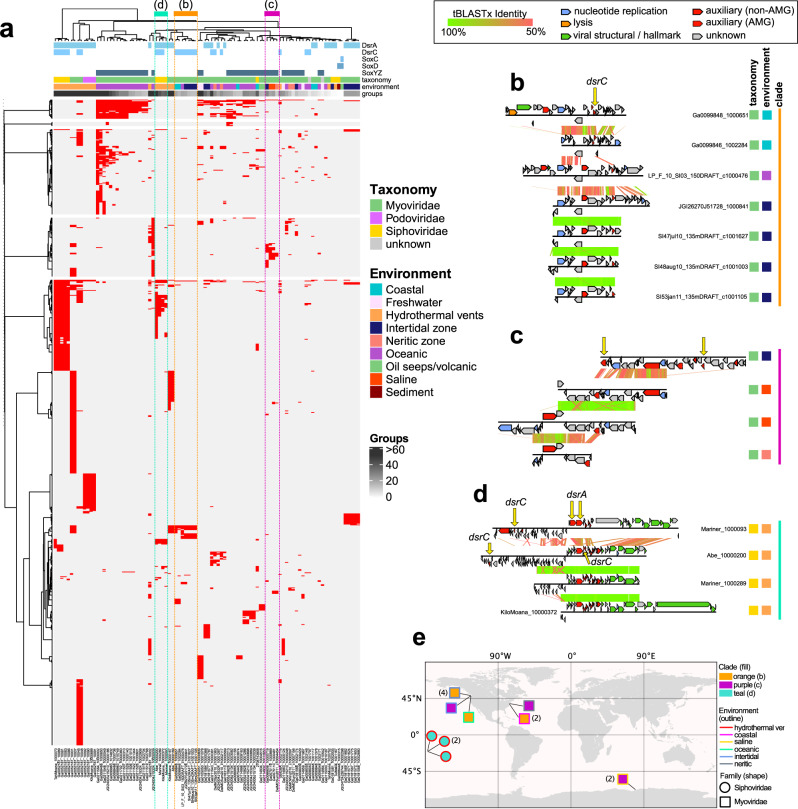
Fig. 5. mVC protein grouping and genome alignments.
a mVC hierarchical protein grouping where each row represents a single protein group (887 total) and each column represents a single mVC (94 total). Metadata for encoded AMGs, estimated taxonomy, source environment and number of protein groups per mVC is shown. Clades respective of b, c, and d are depicted by colored dotted lines. Genome alignments of b seven divergent Myoviridae mVCs encoding dsrC from diverse environments, c four divergent Myoviridae mVCs encoding soxYZ from diverse environments, and d four divergent Siphoviridae mVCs encoding dsrA and dsrC from hydrothermal environments. For the genome alignments, each black line represents a single genome and arrows represent predicted proteins, which are colored according to VIBRANT annotations; genomes are connected by lines representing tBLASTx similarity. e Map of geographic distribution of 15 mVCs depicted in b, c, and d annotated with respective clade, source environment, and taxonomic family.

