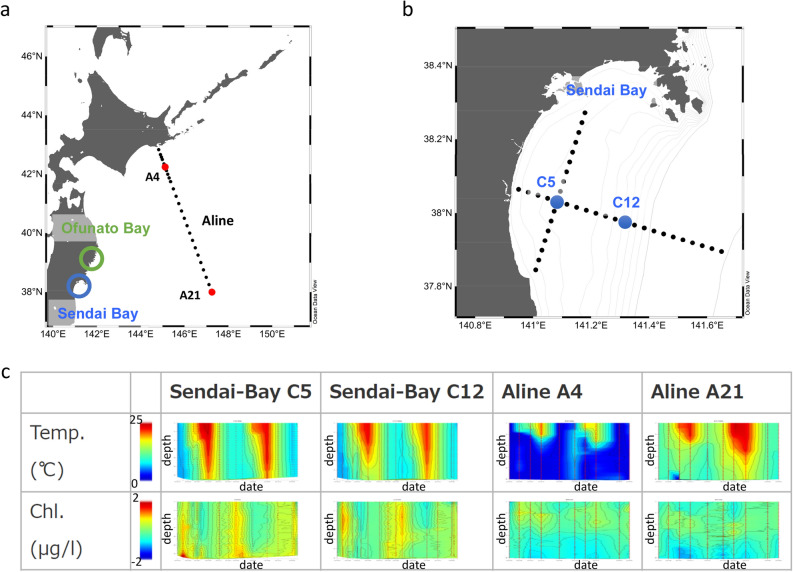
Figure 1.
Location, changes in water temperature, and changes in chlorophyll-a (Chl-a) concentrations at the sampling points. (a) Sampling points along the Pacific coast of northeastern Japan (Sendai Bay, Ofunato Bay, and A-line). (b) Sampling points C5 and C12 in Sendai Bay. The map was generated using Ocean Data View (https://odv.awi.de) with data imported from the NOAA server (accessed on 22 February 2021). (c) Changes in water temperature and chlorophyll concentrations at Sendai Bay and A-line sampling points. Red circles indicate the depth of the sampled water. X-axis: dates from 2012 to 2014. Y-axis: water depth from the surface.

