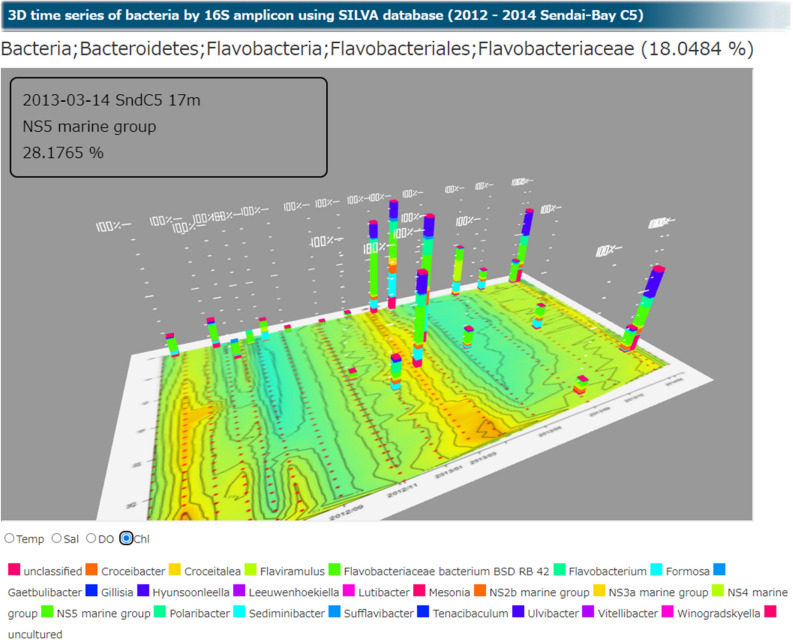
Figure 3.
Three-dimensional (3D) display of microbial communities. 3D display of bacterial communities identified using 16S rRNA gene amplicon analysis of the Sendai Bay C5 samples from 2012 to 2014. The x-axis indicates the date, the y-axis indicates the water depth, and the z-axis indicates the percentage abundance of bacterial genera. The contour plot on the xy plane indicates the chlorophyll concentration. The composition of Flavobacteriaceae is shown as an example.

