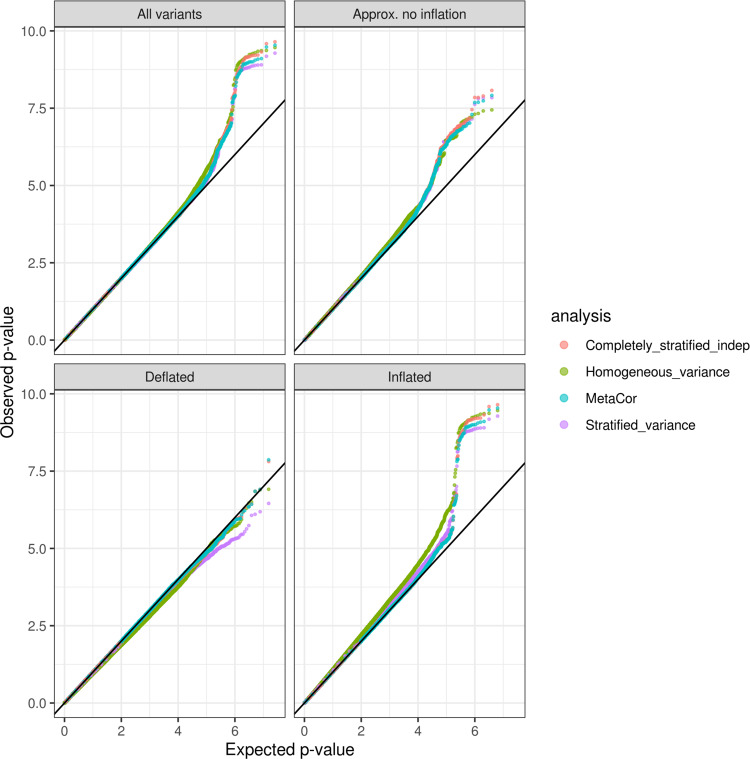
Fig. 3. QQ-plots comparing observed and expected p values (−log10 transformed) from the analysis of BMI.
The analyses used four approaches: “homogeneous variance” model, which assumes that all groups in the analysis have the same variances; “stratified variance” model, which allows for different residual variances across analysis groups; a “completely stratified indep” model in which analysis groups were analyzed separately, allowing for both heterogeneous residual and genetic variances across groups, and then combined together in meta-analysis under independence assumption, and “MetaCor”, a procedure that accounts for relatedness across strata in the meta-analysis. The QQ-plots are provided across sets of variants classified by their inflation/deflation patterns according to the algorithm for variant-specific approximate inflation factors. We categorized variants as “Approx. no inflation” when they had estimated λvs between 0.99 and 1.01, “Deflated” when estimated λvs lower than 0.99, and “Inflated” when they had estimated λvs higher than 1.01.

