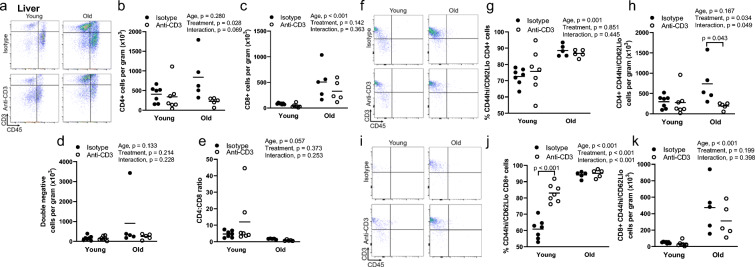
Fig. 3.
Effects of age and anti-CD3 treatment on liver T cell phenotype. The livers from young and old, isotype control and anti-CD3 F(ab’)2-treated mice were dissected, mechanically disrupted, enzymatically digested, and stained with anti-CD45 (leukocytes), anti-CD3 (pan T cells), anti-CD4 (helper T cells), anti-CD8 (cytotoxic T cells), anti-CD44 (memory T cells), anti-CD62L (central/effector), and violetFluor510 Ghost Dye (exclusion of dead cells). a Sample flow cytometry plot assessing liver CD4+ and CD8+ distribution, b CD4+ T cell counts, c CD8+ T cell counts, d double-negative (DN) T cell counts, and e CD4-to-CD8 ratio. f Sample flow cytometry plot for CD4+ naïve/memory phenotype. g Proportion of CD4+ effector memory cells and h cell counts. i Sample flow cytometry plot for CD8+ naïve/memory phenotype. j Proportion of CD8+ effector memory cells and k cell counts. Group differences were assessed by two-way ANOVA and Tukey’s post hoc test

