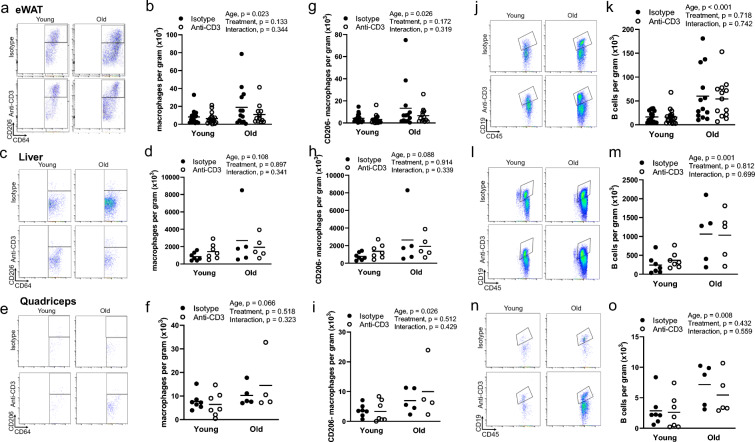
Fig. 7.
Effects of age and anti-CD3 treatment on macrophage and B cell infiltration and phenotype. Epididymal white adipose tissue (eWAT), livers, and quadriceps from young and old, isotype control and anti-CD3 F(ab’)2-treated mice were dissected, mechanically disrupted, enzymatically digested, and stained with anti-CD45 (leukocytes), anti-CD64 (macrophages), anti-CD11c (exclusion of dendritic cells), anti-CD206 (macrophage phenotype), and anti-CD19 (B cells). Sample flow cytometry plots and summary data showing eWAT (a, b), liver (c, d), and quadriceps (e, f) macrophage counts. CD206- macrophage counts in eWAT (g), liver (h), and quadriceps (i). k Sample flow cytometry plots and j quantification of eWAT B cell infiltration. l Sample flow cytometry plots and m quantification of liver B cell infiltration. n Sample flow cytometry plots and o quantification of quadriceps B cell infiltration. Group differences were assessed by two-way ANOVA and Tukey’s post hoc test

