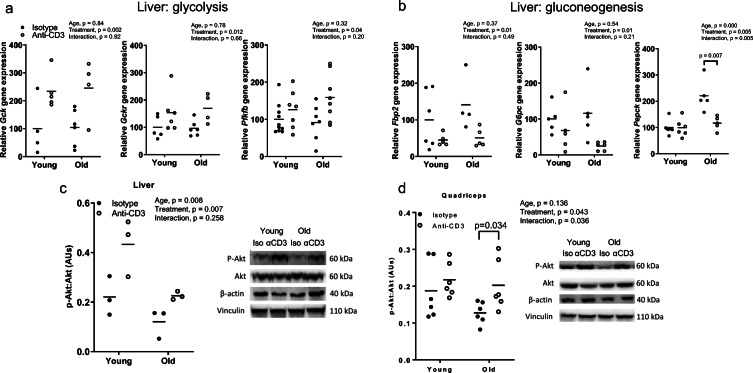
Fig. 9.
Expression of metabolic genes and Akt phosphorylation in the liver and muscle. Glycolytic (a) and gluconeogenic (b) gene expression in the liver. Summary data and representative images of Akt phosphorylation in the (c) liver and (d) quadriceps. Phosphorylation of Akt was normalized to total Akt. Beta actin and vinculin were used as additional control. AU, arbitrary units. Group differences were assessed by two-way ANOVA test and Tukey’s post hoc test

