Fig. 7.
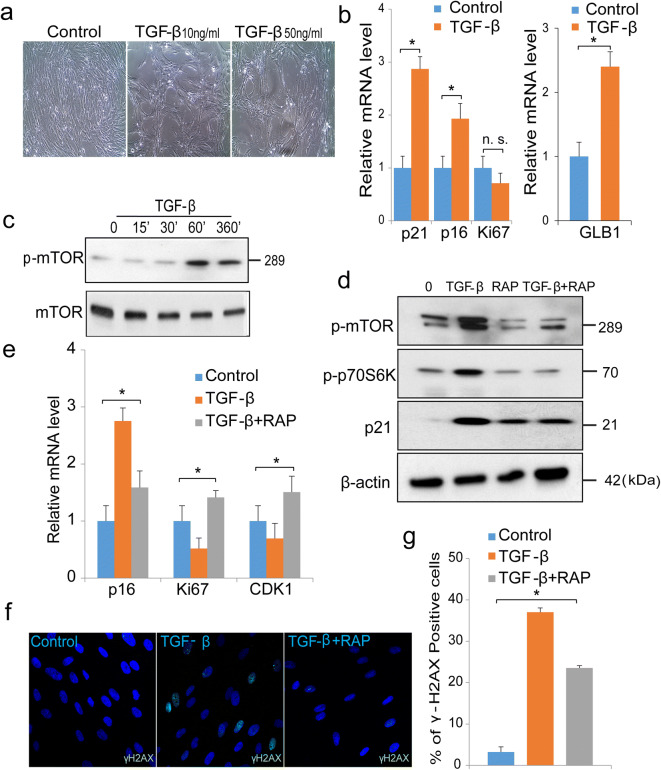
TGF-β accelerates senescence in cultures of preadipocytes via regulation of the mTOR pathway. a Representative images of untreated or control cells or cells stimulated with TGF-β 10 ng/ml or 50 ng/ml for 7 days. b Quantification of mRNA of p21, p16, Ki67, and GLB1 in control cells or cells stimulated with TGF-β (50 ng/ml) for 7 days by real-time PCR. Data represent mean of three independent experiments. c Western blotting analysis of phosphorylated mTOR in cells treated with TGF-β (20 ng/ml) for indicated times. d Cells pre-treated with the mTOR inhibitor rapamycin (10 μm) 30 min prior to stimulation with TGF-β (50 ng/ml) for 7 days. Protein extracts were analyzed for phosphorylated mTOR, phosphorylated p70S6Kinase, and p21. β-actin was used as loading control. e Real-time PCR analysis of control cells or cells treated with rapamycin (10 μm) and TGF-β (50 ng/ml) or TGF-β (50 ng/ml) alone for 7 days. p16, Ki67, and CDK1 were normalized to GADPH, which was used as an internal control. Data represent mean of three independent experiments. f Immunofluorescence staining of γH2AX foci with nuclear DAPI staining in control or treated with TGF-β (50 ng/ml), or cells treated with rapamycin (10 μm) and TGF-β (50 ng/ml) for 7 days. Scale bar 10 μm. g Percentage of γH2AX foci in control or cells treated with TGF-β (50 ng/ml), or cells treated with combination of rapamycin (10 μm) and TGF-β (50 ng/ml) for 7 days. *denotes statistical significance (*p < 0.05), n.s. denotes not significant. Error bars represent SEM

