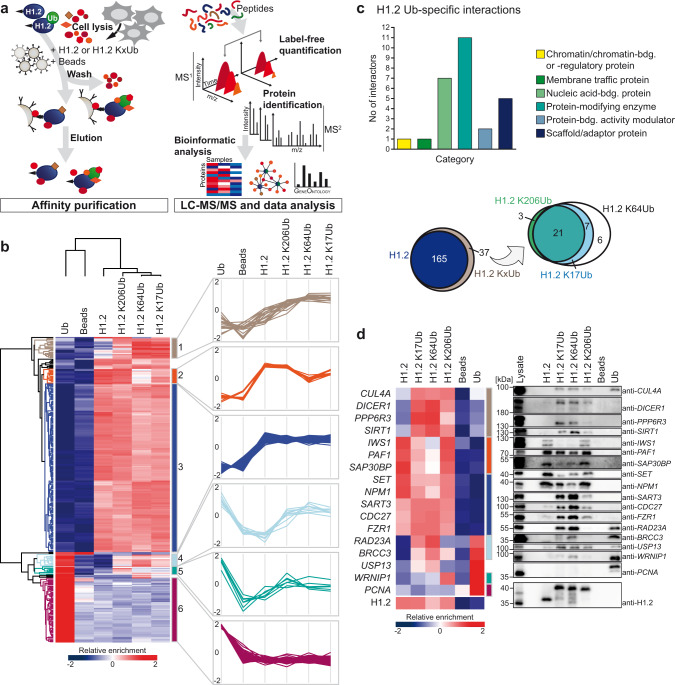
Fig. 2. Identification of the ubiquitylation-dependent modular H1.2 KxUb interactome.
a Schematic overview of the AP-MS-based workflow to identify interactors of H1.2 KxUb variants. b Hierarchical clustering of statistically significant interactors following ANOVA analysis (FDR = 0.001, S0 = 2, n = 3). Interacting proteins are shown in rows, columns represent bait proteins used in AP-MS experiments. AP-MS experiments were carried out in biological triplicates in HEK 293T whole cell lysates. Empty beads (no bait protein) and beads decorated with free Ub were added as controls. Clusters of proteins with similar interaction behavior are depicted in different colors (left). Profile plots of clusters with specific binding patterns are shown on the right. c Venn diagrams (bottom) of all proteins that specifically interact with unmodified H1.2 or H1.2 KxUbs, respectively (left) and all H1.2 KxUb-specific interacting proteins with site-specific resolution (right), not including interactors of free Ub (for those see cluster 6). Further GO-term analysis of all ubiquitylation-specific H1.2 KxUb-interacting proteins based on PANTHER classification (top). d Heatmap showing the relative enrichment of selected proteins as identified by AP-MS (left) and by immunoblotting (right). Lysate and elution fractions of the affinity purification assay were subjected to western blot analysis with antibodies specific for the indicated proteins.

