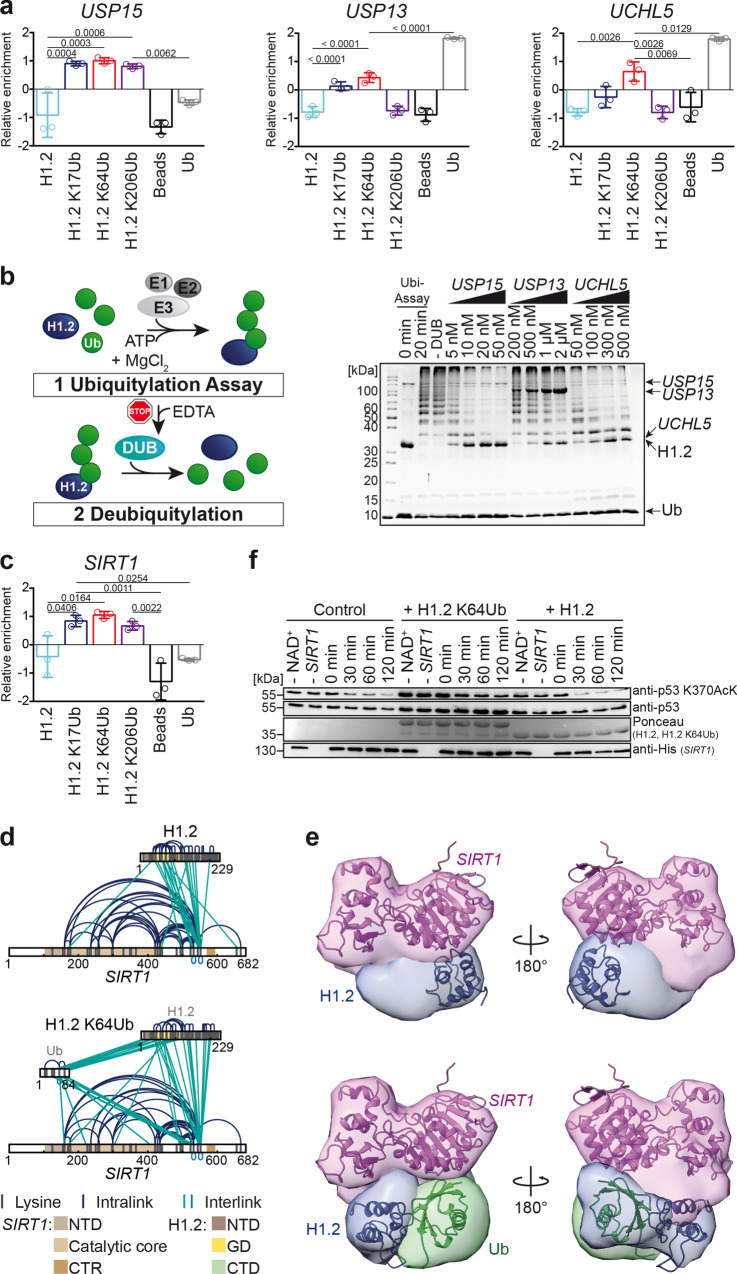
Fig. 3. Functional characterization of H1.2 KxUb-specific interactions with DUBs and SIRT1.
a Relative enrichment patterns of DUBs USP15, USP13, UCHL5. Plotted is the mean of the Z-scores from the quantitative proteomics data. Shown are mean values +/− standard deviation, n = 3, one-way ANOVA (repeated measures) with Tukey’s multiple comparisons test with α = 0.05, 95% confidence interval. Selected significance lines and exact p values with p ≤ 0.05 are shown, for complete results of significance analysis see Supplementary Fig. 5. b Scheme representing the workflow of the deubiquitylation assay (left). H1.2-deubiquitylation assay for USP15, USP13, and UCHL5 (right). −DUB indicates that no DUB was added after the ubiquitylation assay. c Relative enrichment pattern of SIRT1. Plotted is the mean of the Z-scores from the quantitative proteomics data. Shown are mean values +/− standard deviation, n = 3, one-way ANOVA (repeated measures) with Tukey’s multiple comparisons test with α = 0.05, 95% confidence interval. Selected significance lines and exact p values with p ≤ 0.05 are shown, for complete results of significance analysis see Supplementary Fig. 5. d Overall crosslinking pattern of H1.2: SIRT1 (top) or H1.2 K64Ub: SIRT1 (bottom) complexes. NTD = N-terminal domain, CTR = C-terminal regulatory domain of SIRT1; structural domains of H1.2 as described before. e Models of the H1.2: SIRT1 (top) and H1.2 K64Ub: SIRT1 (bottom) complex. Bayesian crosslinking guided integrative structural modeling using the crystal structures of SIRT1 (PDB: 4ig9), Ub (PDB: 1ubq), and the chicken H1 GD (PDB: 1ghc) together with our crosslinking data as input. Shown are crystal structures overlaid with the average cluster density. The second cluster for H1.2 K64Ub: SIRT1 is depicted in Supplementary Fig. 7. f In vitro deacetylation assay for SIRT1 and model substrate protein p53 K370AcK in the presence of H1.2, H1.2 K64Ub or in the absence of any histone (Control). −NAD+ and −SIRT1 indicate that the respective component was not present in the reaction mixture. Protein and acetylation intensities were visualized by western blot and Ponceau S staining.

