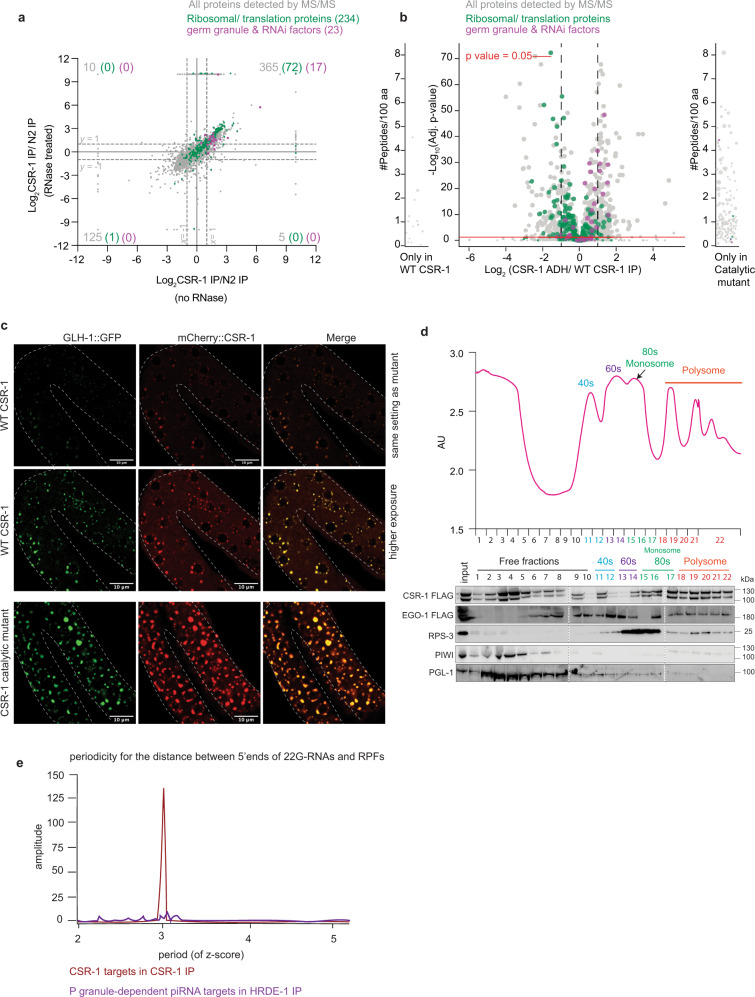
Fig. 4. CSR-1 22G-RNAs are synthesized concomitantly with mRNA translation.
a Scatter plot comparing the log2 fold-changes in CSR-1 interactors (IP-MS/MS) to control IPs performed in WT strain in the absence of RNase treatment (x-axis) to the IPs performed after RNase treatment (Supplementary Data 2). Ribosomal proteins and translation regulators are highlighted in green, and germ granule proteins, including RNAi factors, are highlighted in magenta. Number in gray refers to all interactors with log2 fold-change of ≥1 and P-value ≤ 0.05 for each quadrant. The number in parenthesis is for ribosomal and translation-associated proteins enriched and granule and RNAi factors. n = 4 biological replicates. b Volcano plot showing log2 fold-change in enrichment values and corresponding significance levels for proteins co-purifying with CSR-1 ADH compared to WT CSR-1 (Supplementary Data 3). Ribosomal proteins and translation regulators are highlighted in green. Germ granule proteins, including RNAi factors, are highlighted in magenta. The size of the dots is proportional to the number of peptides used for the quantification. The linear model was used to compute the protein quantification ratio, and the red horizontal line indicates the two-tailed P-value = 0.05. n = 4 biological replicates. c Live-fluorescent images showing localization and expression of GLH-1::GFP (P granule marker) and WT mCherry::CSR-1 or catalytic mutant mCherry::CSR-1 ADH. In WT, CSR-1 is localized to the cytosol and P granule. In CSR-1 catalytic mutant, CSR-1 is predominantly localized in enlarged P granules (Brightness of WT strain enhanced in middle panel for better visualization as the expression level of the mutant protein is higher than WT). At least five individual germlines were imaged for each strain. d Representative polysome profile indicating elution fractions with sub-monosomal, monosomal and polysomal complexes. Immunoblot for FLAG::CSR-1, FLAG::EGO-1 with anti-FLAG antibody and RPS-3, PIWI, and PGL-1 with their respective antibodies in sub-monosomal, monosomal, and polysomal fractions. The blots have been reproduced. e Periodogram based on Fourier transform for read-density around RPF 5ʹ start position showing periodicity of CSR-1 22G-RNAs phasing with RPFs. P granule-dependent piRNA targets in HRDE-1 IP were used as control. Data is representative of two biological replicates. Source data are provided as a Source Data file.

