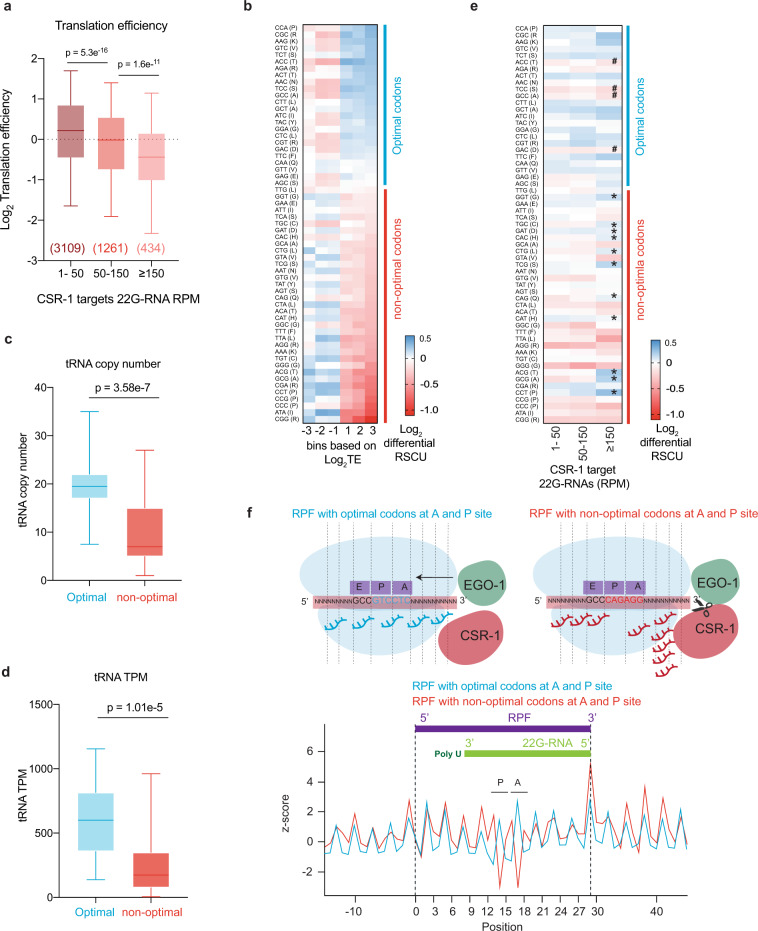
Fig. 5. Highly translated mRNAs and optimal codons negatively correlate with CSR-1 22G-RNA abundance.
a Translation efficiency Log2 (RPF TPM/ mRNA TPM) for CSR-1 targets in WT strain. The distribution for the 22G-RNA in CSR-1 IP for CSR-1 targets with 1–50 RPM, 50–150 RPM, or ≥150 RPM. The sample size n (genes) is indicated in parentheses. The line indicates the median value, the box indicates the first and third quartiles, and the whiskers indicate the 5th and 95th percentiles, excluding outliers. Two-tailed P- values were calculated using Mann–Whitney–Wilcoxon tests. The sample size n (genes) is indicated in parentheses. Data is an average of two biological replicates. b Heat map showing log2 fold-change in Relative Synonymous Codon Usage (RSCU) for all protein-coding genes categorized by increasing translational efficiency compared to genes showing neutral translational efficiency of 1, as explained in methods. Codons are arranged in order of decreasing RSCU (top to bottom) in the category of log2 TE ≥ 3. The blue line highlights optimal codons in genes with high TE, and the red line highlights non-optimal codons. c, d Box-plot showing the copy numbers for tRNAs for optimal or non-optimal codons (c), and the TPMs for tRNAs from the GRO-seq dataset for WT strain at the late l4 larval stage (44 h) for optimal or non-optimal codons (d). The line indicates the median value, the box indicates the first and third quartiles, and the whiskers indicate the 5th and 95th percentiles, excluding outliers. Two-tailed P-values were calculated using Mann–Whitney–Wilcoxon tests. Two biological replicates. For codons with missing cognate tRNA, values have been adjusted by considering tRNA copy numbers and TPMs for tRNA recognizing these codons by wobble base pairing90. (see Supplementary Fig. 8b, c for non-adjusted values). e Heatmap similar to b showing log2 fold-change in relative synonymous codon usage for all CSR-1 targets (1–50, 50–150, and ≥150 RPM of 22G-RNA) compared to genes showing neutral translational efficiency as explained in methods. “*” marks over-used non-optimal codons by CSR-1 targets and “#” marks under-used optimal codons. f Plot showing the z-score for the read-density for the of 5ʹ terminus of 22G-RNAs for CSR-1 targets relative to the start of 29-nt long Ribosomal protected fragments (RPF) with either optimal or non-optimal codons at their P and A site. The scheme shows possible initiation of 22G-RNA biogenesis after a slicing event downstream of RPF with non-optimal codons at the A and P sites. Source data are provided as a Source Data file.

