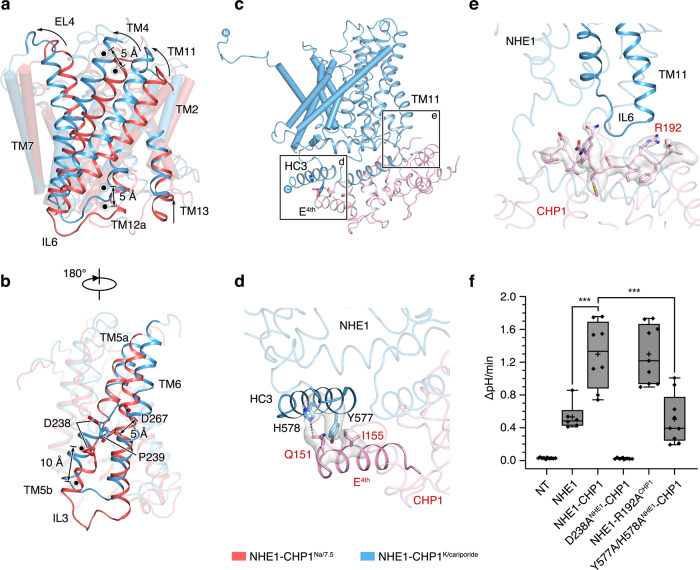
Fig. 5. Conformational change between the inward- and outward-facing NHE1.
a, b Conformational change of the core domain relative to the dimerization domain, between the inward- (red) and outward-facing (blue) states. Dimerization domains are used for superimposition and shown in cylindrical helices. The COMs of residues of the core domain at extracellular side (V214, L224, A281, W411, L468, and M476) and intracellular side (L186, V245, E253, F439, P446, and V503) are depicted as black dots. Distances between COMs are indicated. Panel a and b differ by 180°. c–e Interaction between NHE1 and CHP1. The NHE1 and CHP1 molecules are colored in blue and pink, respectively. Sidechains are depicted as sticks and the cryo-EM density map is shown in surface models. f Measurement of NHE1 activity. AP-1 cells were transiently transfected with mCherry fluorescent protein alone (NT, no transporter), wild-type NHE1 tagged at its C-terminus with mCherry alone, or wild-type or mutant NHE1 co-expressed with either wild-type CHP1 or mutant CHP1 (R192ACHP1), as indicated. The mCherry signal was used to identify transfected cells. The cells were acid-loaded by prepulsing with NH4+ (as described in Methods section) and NHE1 activity was defined as the initial linear rate of pH recovery (ΔpH/min) upon addition of Na+ to the bathing medium. Data are plotted as a box plot, with the box encompassing the interquartile range (25th−75th percentile) including the mean (plus sign) and the median (straight line), and the whiskers showing the 99% confidence interval. Each symbol represents a single cell, and between 6 and 10 cells (n value) were analyzed from two independent experiments (NT, n = 10; NHE1, n = 6; NHE1-CHP1, n = 8; D238ANHE1-CHP1, n = 8; NHE1-R192ACHP1, n = 9; Y577A/H578ANHE1-CHP1, n = 9). Significance from WT was determined by one-way ANOVA (total degrees of freedom = 49; F value = 42.1, P value = 1.094 × 10⁻¹⁵), with a post-hoc Tukey test (***, NHE1:NHE1-CHP1, P = 3.42096 × 10⁻⁵, NHE1-CHP1: Y577A/H578ANHE1-CHP1, P = 2.16504 × 10⁻⁶). Source data are provided as a Source Data file.

