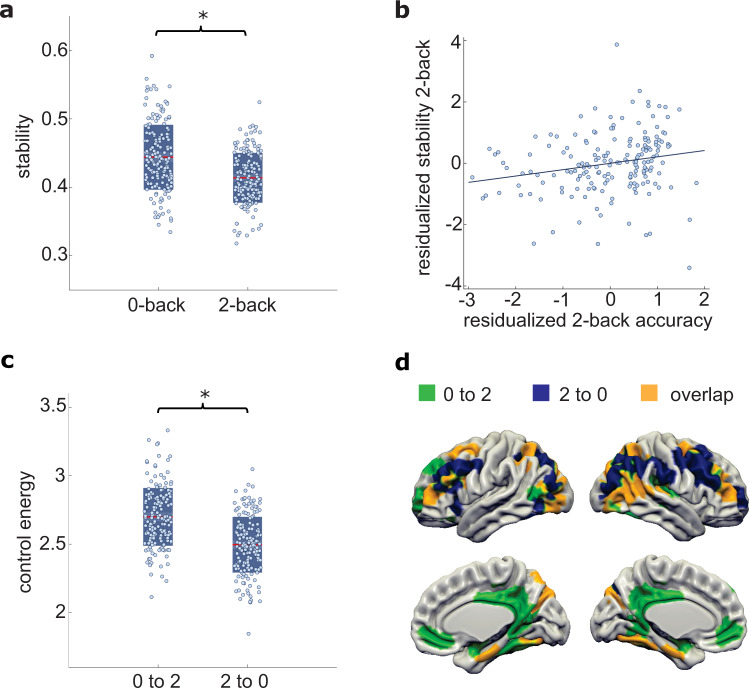
Fig. 2. Controllability and stability of brain dynamics during working memory.
a The stability of the 2-back state reflecting working memory activity is lower than that of the 0-back state reflecting motor and basic attention control activity (F(1173) = 66.80, p < 0.001). Red lines indicate mean values and boxes indicate one standard deviation of the mean. b Associations of 2-back stability with working memory performance (accuracy: b = 0.274, p = 0.006; covarying for age, sex, and mean activity). c Steering brain dynamics from the control condition to the working memory condition (0–2) requires more control energy than vice versa (F(1174) = 27.98, p < 0.001). d Unique and common sets of brain regions contributing to the transition from 0-back to 2-back and the transition from 2-back to 0-back, respectively. For illustrative and exploratory purposes, we projected the computed control impact of each brain region for the respective transitions on a 3D structural template, displaying the regions with the 20% highest control impact for each transition (see SI for the illustration of alternative thresholds). Black lines indicate mean, dark boxes indicate 1 standard deviation, light boxes indicate 1.96 SEM and asterixis denote significance at p < 0.05. Source data are provided with this paper.

