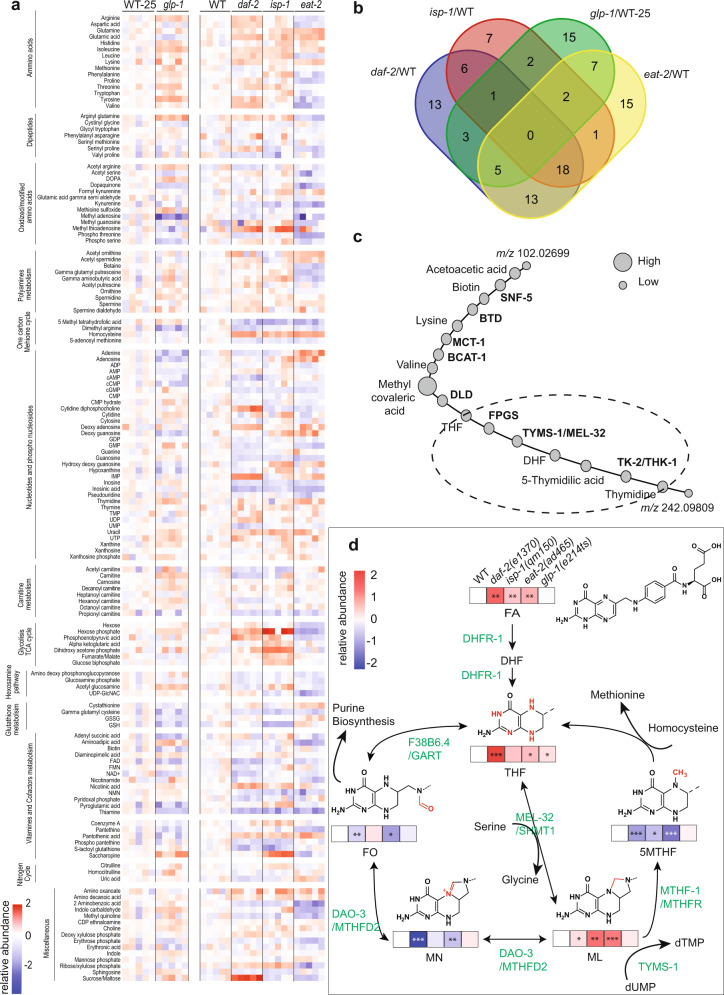
Fig. 1. Regulation of the folic acid cycle is altered in longevity mutants.
a Untargeted metabolomic analysis of daf-2(e1370), eat-2(ad465), isp-1(qm150), and glp-1(e2141)ts worms at day 1 of adulthood. glp-1(e2141)ts worms are compared with wild-type (WT) control, which undergoes the same 25 °C thermal shift as the mutant. Heat map containing all biological replicates, indicates the relative abundance of metabolite concentrations relative to the wild-type average, including both significant and non-significant changes, (listed in Supplementary Data 1). Metabolites are manually grouped into different functional categories. b Venn diagram of the significantly changed metabolites (adj p < 0.05) for each genotype showing unique and overlapping compounds. c Metabolic-protein network of unknown and known features created by the PIUMet algorithm (http://fraenkel-nsf.csbi.mit.edu/piumet2/). The degree of confidence of the PPI algorithm is represented by node diameters. Additional parameters are found in Supplementary Table 5. Dotted circle indicates the region of the network chosen for further investigation. Abbreviations in the chart: SNF-5 (Sodium: Neurotransmitter symporter Family, orthologous to SLC6A8), BTD (biotinidase), MCT-1 (Mono carboxylate Transporter family, orthologous to SLC16A14), BCAT-1 (branched amino acids transporter), DLD (dihydrolipoamide dehydrogenase), FPGS (folylpolyglutamate synthase), TYMS-1 (thymidylate synthetase), MEL-32 (orthologue of SHMT1 serine hydroxymethyl transferase 1) THK-1 (thymidine kinase-1). d Quantitation of folic acid intermediates using targeted metabolomic analysis in longevity mutants (day 1 adult). FA, THF, and ML accumulate in three out of four longevity mutants. 5MTHF significantly decreases in three longevity mutants. Abbreviations in the chart: FA (folic acid), DHF (dihydrofolic acid), THF (tetrahydrofolic acid), 5MTHF (5‐methyl‐tetrahydrofolic acid), ML (5,10‐methylene‐tetrahydrofolic acid), MN (5,10‐methenyl‐tetrahydrofolic acid), FO (formyl‐tetrahydrofolic acid). a, d N = 5 independent biological replicates. a, d Normalized metabolite concentrations are converted to log2 for heat map generation. a, b Statistics were performed using one-sided Fisher test and Benjamini–Hochberg correction for multiple comparisons (adj p < 0.05) and d using one-way-ANOVA and Dunnett’s multiple comparison *p < 0.5, **p < 0.01, ***p < 0.001 (Supplementary Table 6, for statistics).

