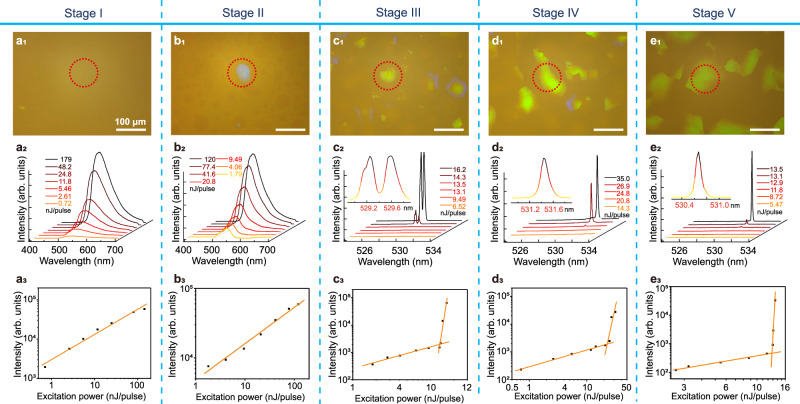
Fig. 7 Band-edge lasing of BPI in each phase-transition stage.
a1–e1 Platelet textures of dye-doped PS-BPLCs captured using an inverted optical microscope in reflection mode; red dotted circles mark the greenish lasing phase platelets. a2–e2 Emission spectra plotted relative to the low-energy photonic band-edge. The insets show magnified images of the lasing peaks. The measured FWHMs of the lasing peaks vary from 0.579 to 0.105 nm. a3–e3 Best fits of typical input-output curves for the data below and above the excitation threshold. Lasing is realized in a relatively small BPI domain (~60 μm) based on the high degree of order of BCC structures. The gradual narrowing of the lasing peaks from Stages III to V suggests an improvement in the lattice order of BPI.

