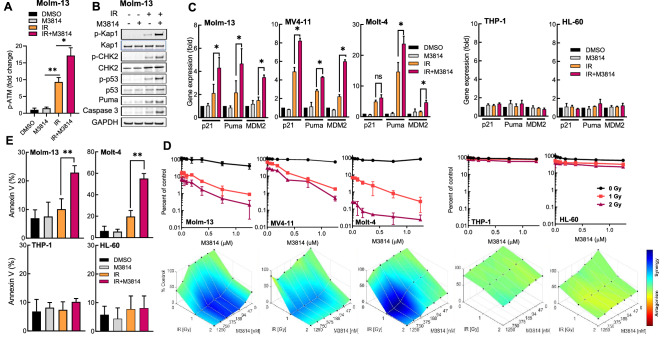
Figure 1.
M3814 over-activates IR-induced p53 apoptotic signaling in acute leukemia cells. (A) Molm-13 cells were pre-treated with M3814 (1 µM) or vehicle for 45 min before exposure to IR (2 Gy). Protein lysates were isolated 4 h after irradiation and analyzed by MSD for phospho-ATM (Ser1981) and ATM. Results shown as fold change in p-ATM normalized to total ATM protein. (B) Molm-13 cells were treated as in A. Protein lysates were isolated 4 h after irradiation and analyzed by Western blotting using antibodies for phospho-Kap1(Ser824), Kap1, phospho-CHK2(Thr68), CHK2, phospho-p53(Ser15), p53, Puma, cleaved caspase-3 and GAPDH. Panel displays cropped images from repeat blots divided and probed for different targets. Full-sized blots are presented in Supplementary Fig. 1. (C) Molm-13, Molt-4, MV4-11, THP-1 and HL-60 cells were M3814-treated and irradiated as in A. RNA was isolated 4 h post-IR and p53 target gene expression was assessed by qPCR using probes for p21, MDM2 and Puma. Expression levels were normalized to GAPDH. (D) Molm-13, Molt-4, MV4-11, THP-1 and HL-60 cells were pre-treated with increasing M3814 concentrations for 45 min before exposure to IR (1 Gy or 2 Gy). Cell growth/viability was assessed via CellTiter Glo assay on d 4. Shown are individual M3814 dose–response curves (top) and overlays of Bliss synergy on relative viability landscapes (bottom). Bliss synergy was determined using Combenefit software. (E) Molm-13, Molt-4, THP-1 and HL-60 cells were treated as in A, then exposed to 1 Gy IR and 24 h later cells undergoing apoptosis were assessed by flow cytometry using a PE-conjugated annexin V. *p < 0.05, **p < 0.01, ***p < 0.001. NS: p > 0.05.

