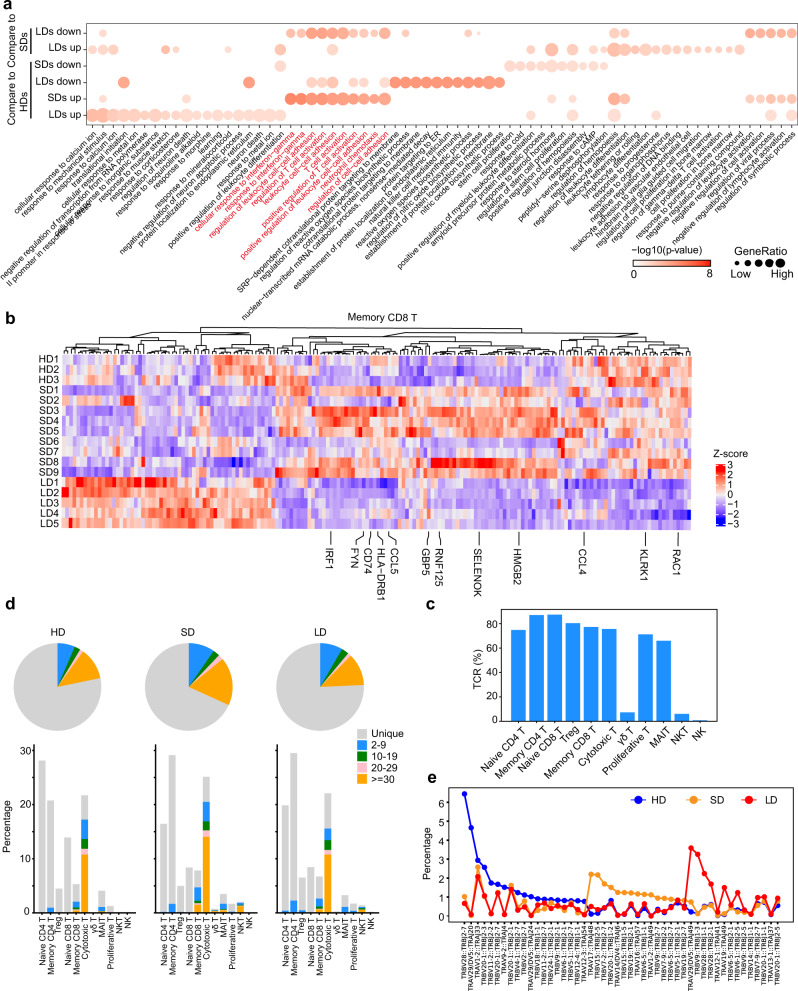
Fig. 5. Molecular features of T cells in LDs and SDs.
a Enriched GO pathways of COVID-19 groups in memory CD8+ T cells (top 2 columns: DEGs between LDs and SDs, bottom 4 columns: DEGs for SDs and LDs compared to HDs. Pathway enriched by SDs upregulated genes are labeled in red. The color intensity indicates the enrichment p values and the point size indicates the ratio of gene enrich in each pathway. b Hierarchical clustering of expression of DEGs in memory CD8+ T cells at sample level. The color intensity indicates the relative expression of each gene. c, d The clonal status percentage of T cells and that at each cell type resolution in three groups. e The percentage of selected clonal types in three groups. Source data are provided as a Source Data file.

