
Figure 4.
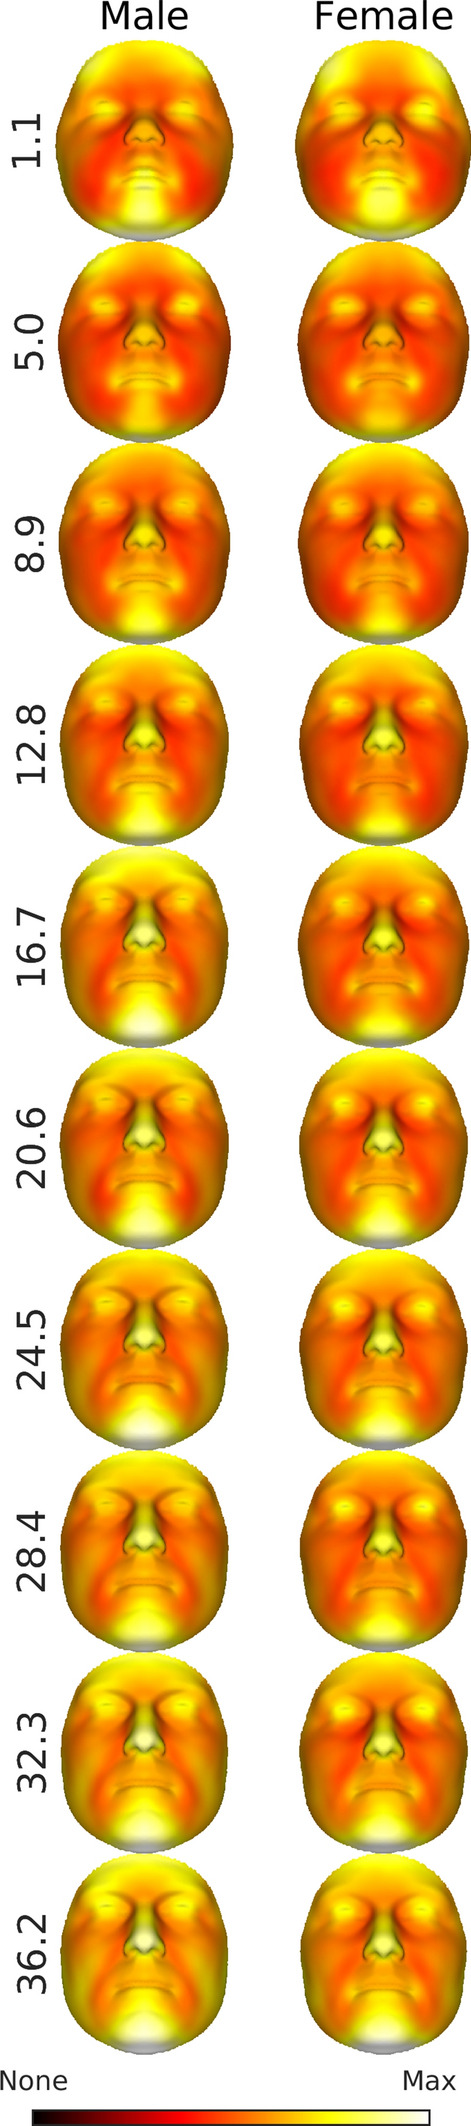
Root mean-square variation around the expected faces for some example ages. All color-maps use the same color-scale and are therefore comparable visually. This figure was generated in MATLAB 2021a (https://www.mathworks.com/).
Official websites use .gov
A
.gov website belongs to an official
government organization in the United States.
Secure .gov websites use HTTPS
A lock (
) or https:// means you've safely
connected to the .gov website. Share sensitive
information only on official, secure websites.
Root mean-square variation around the expected faces for some example ages. All color-maps use the same color-scale and are therefore comparable visually. This figure was generated in MATLAB 2021a (https://www.mathworks.com/).