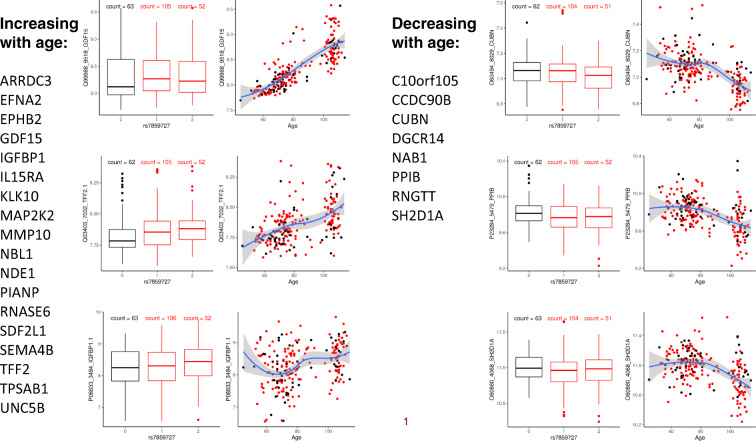
Fig. 3.
Examples of pQTLs in CDKN2B. Example of 6 proteins that correlate with genotypes of the SNP rs7857345 in the CDKN2B that was associated with extreme human longevity in the genome-wide association studies in the New England Centenarian Study and LonGenity Gene Project. For each protein: the boxplots on the left show the distribution of the log-transformed protein data by genotype group (black = homozygote genotype for the longevity allele; red = genotypes on carriers of 1 or 2 non-longevity alleles); the scatter plot on the right shows the distribution of the log-transformed protein data (y-axis) versus the age of study participants (x-axis). The 3 plots on the left show 3 proteins that increase with age and are on average lower in carriers of the longevity-associated variant (black). The 3 plots on the right show 3 proteins that decrease with age and are on average higher in carriers of the longevity-associated variant

