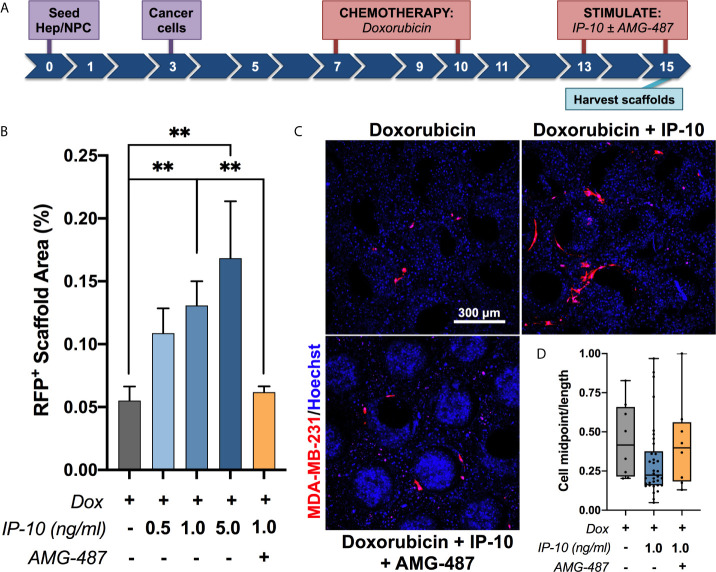
Figure 2.
IP-10 promotes the emergence of dormant breast cancer cells in an ex vivo hepatic niche. (A) Experimental timeline schematic. (B, C) Quantification and representative images of the outgrowth of dormant MDA-MB-231 cells following stimulation in the presence or absence of an inhibitor (AMG-487) for 48 hours on day 15 (mean ± SEM; Mann-Whitney test, **p < 0.01; n = 2-5 donors). Blue – DAPI; Red – MDA-MB-231 RFP+ cells. (D) Quantification of the cell midpoint-to-length ratio of MDA-MB-231 RFP+ cells within the representative images depicted in (C) (median with quartiles and range).

