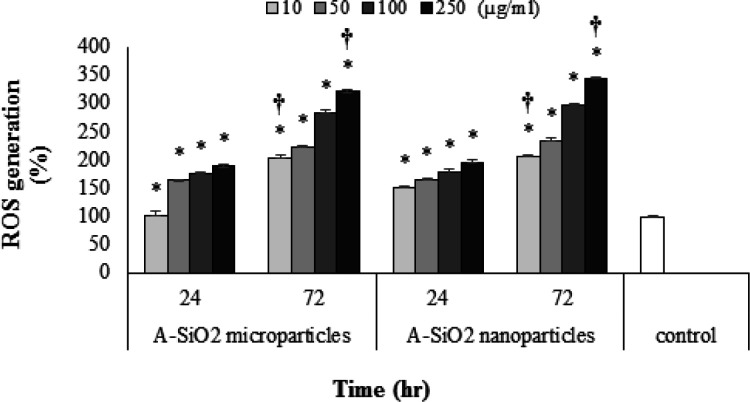
Figure 5.
Intracellular ROS Generation in 24- and 72-Hour Exposure Periods to 10, 50, 100 and 250 µg/ml Concentrations of A-SiO2 Nano- and Microparticles. (Results of mean ± SD of ROS generation percent from three experimental tests). * † Significant statistical differences; 1) between experimental groups compared to control and 2) between comparative experimental groups exposed to micro- and nano-sized particles (p-value <0.05)

