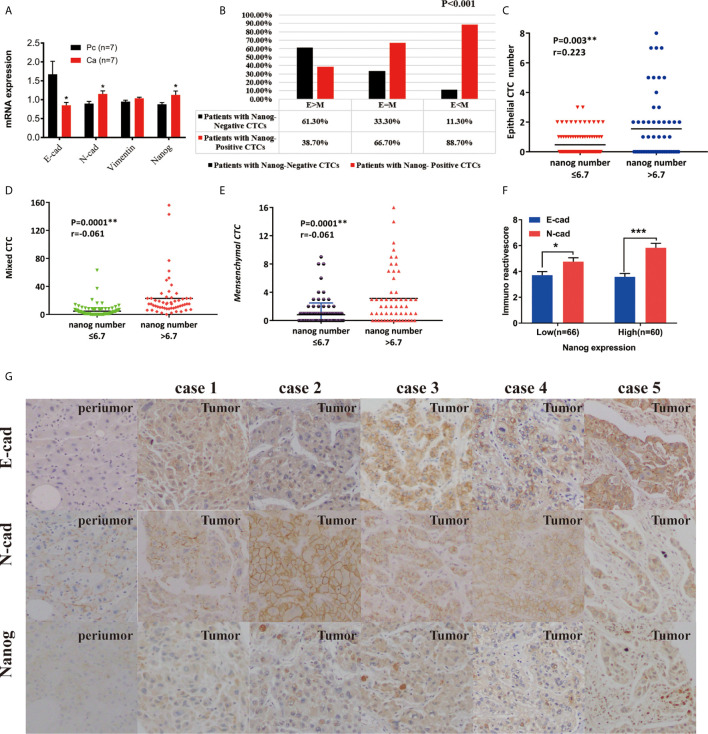
Figure 3.
The expression of Nanog and CTCs in liver cancer peripheral blood and clinical liver cancer tissues. (A) Expression differences of E-cadherin, N-cadherin, and Nanog in 7 pairs of cancer and adjacent tissues (*P < 0.05 , 2-△△Ct). (B) The correlation between the phenotype of CTC and the Nanog positive rate in peripheral blood. (C–E) Correlation between phenotype and number of Nanog in peripheral blood. (F, G) Immunochemistry : Expression of E-cadherin, N-cadherin and Nanog in liver cancer tissues and their paired adjacent tissues (magnification, ×100 and ×400). ***P < 0.001.

