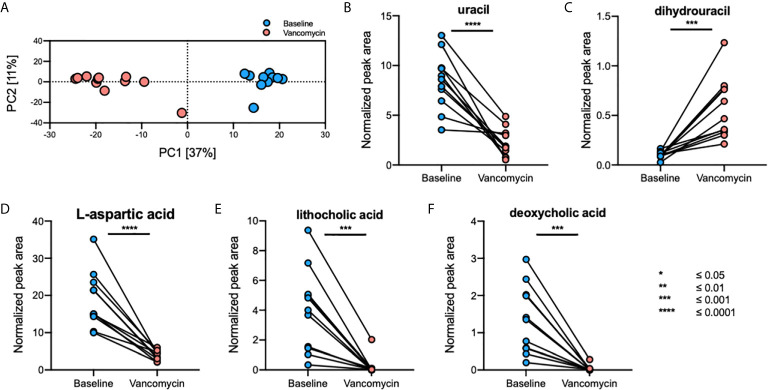
Figure 3.
Oral vancomycin-induced alterations in the gut metabolome. (A) PCA plot derived from fecal metabolomics analysis and spaghetti plots derived from the normalized peak area of gut metabolic markers selected using volcano-plot analysis; (B) levels of uracil, (C) dihydrouracil, (D) L-aspartic acid, (E) lithocholic acid, and (F) deoxycholic acid. Statistical analysis of gut metabolic markers was performed using the Wilcoxon matched-pairs signed-rank test or the paired t-test based on the Shapiro-Wilk normality test. *p ≤ 0.05; **p ≤ 0.01; ***p ≤ 0.001; ****p ≤ 0.0001.

