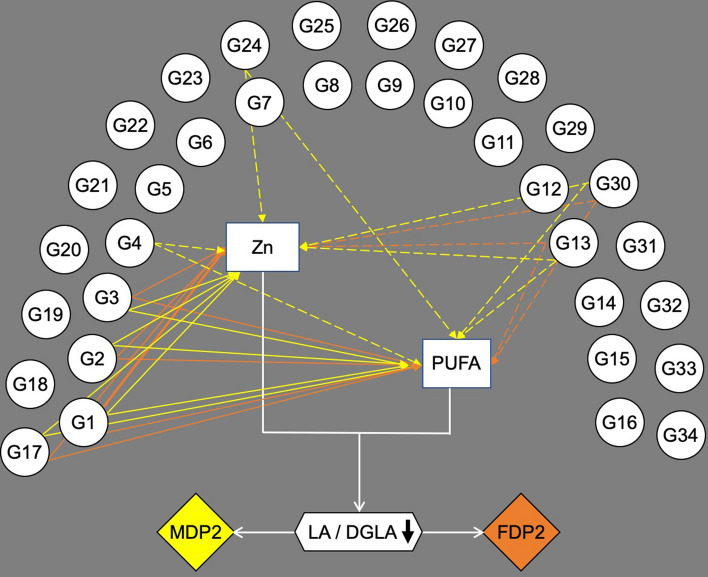
Figure 3.
Pipeline and graphical results by which reduced rank regression identified food groups based on intake of zinc (Zn) and polyunsaturated fatty acids (PUFA) followed by multiple linear regression analysis to test for associations of dietary patterns and serum linoleic/dihomo-γ-linolenic ratio (LA/DGLA). Circles with G are the food groups, rectangles are Zn and PUFA intake values, diamonds are dietary patterns 2 for males (MDP2) and females (FDP2). Each dietary pattern (rectangles) is represented by a combination of food groups that explained as much variation of Zn and PUFAs intake. Solid lines are positive and dashed lines are negative associations between food groups and Zn and PUFAs intake. FDP2 and MDP2 (rich in Zn and poor in PUFAs) were associated with low LA/DGLA ratio.

