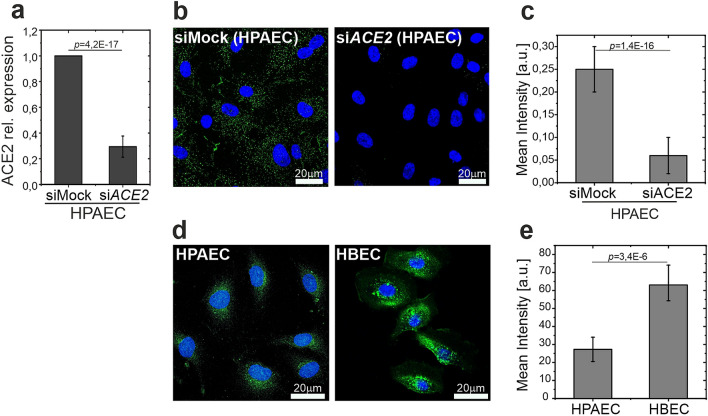
Figure 1.
Examination of the presence of ACE2 in human ECs. (a) Expression of ACE2 in siMock and siACE2-transfected HPAECs. (b,c) Immunofluorescent staining of HPAECs transfected with ACE2-targeting (siACE2) and non-targeting (siMock) siRNA, with anti-ACE2 antibody. Representative photographs and quantitative analysis of immunofluorescence intensity. (d,e) Immunofluorescent staining of ACE2 in HPAECs and HBECs. Representative photographs and quantitative analysis of immunofluorescence intensity. Statistics: p values were determined by one-way ANOVA followed by Tukey’s post-hoc test. Figure created with OriginPro2021 (https://www.originlab.com/2021) and ImageJ 1.53e (https://imagej.nih.gov/ij/).

