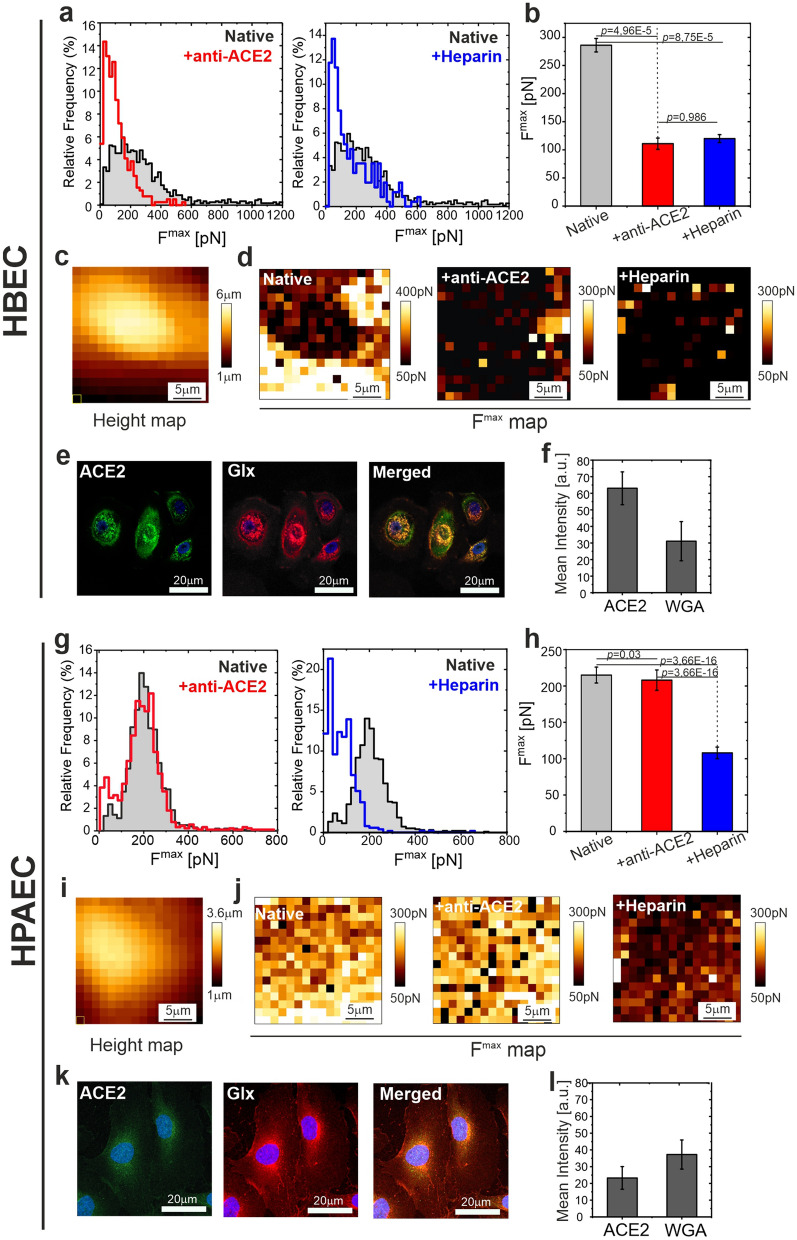
Figure 3.
Differences in adhesive interactions between the S-proteins of SARS-CoV-2 and the surfaces of human bronchial epithelial cells (HBECs) and human pulmonary artery endothelial cells (HPAECs). (a) Histograms of the maximal detachment force Fmax for HBECs. Left: comparison of data for native and anti-ACE2 treated cells. Right: comparison of data for native and heparin treated system. (b) Comparison of mean values determined from histograms. (c) AFM height map measured for a single HBEC cell. (d) Corresponding adhesive maps measured for this cell. Left: native cell. Middle: anti-ACE2 treatment. Right: heparin treatment. (e) Fluorescent staining of ACE2 (green, left column), glycocalyx (Glx, red, middle column) and Merged (right column). (f) Quantitative data of ACE2 and Glx mean fluorescence intensity. (g) Histograms of the maximal detachment force Fmax for HPAECs. Left: comparison of data for native and anti-ACE2 treated cells. Right: comparison of data for native and heparin treated system. (h) Comparison of mean values determined from histograms. (i) AFM height map measured for a single HPAEC cell. (j) Corresponding adhesive maps measured for this cell. (k) Fluorescent staining of ACE2 (green, left column), Glx (red, middle column) and Merged (right column) (l) Quantitative data of ACE2 and Glx mean fluorescence intensity. Left: native cell. Middle: anti-ACE2 treatment. Right: heparin treatment. Statistics: p values were determined by one-way ANOVA followed by Tukey’s post-hoc test. Experimental details are listed in Supplementary Table 1. Source data are provided as a Source Data file. Figure created with OriginPro2021 (https://www.originlab.com/2021), ImageJ 1.53e (https://imagej.nih.gov/ij/) and JPK Data Processing 6.1.79 (https://www.jpk.com/).

