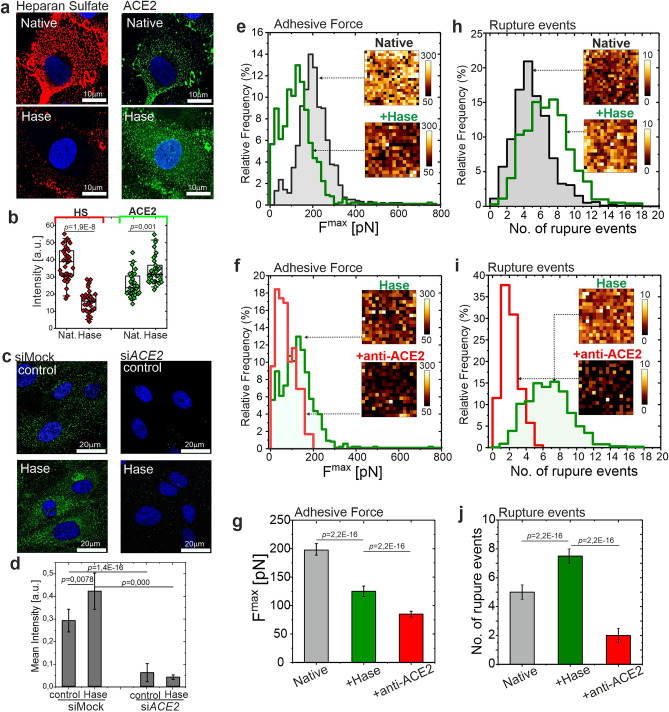
Figure 4.
Removal of heparan sulfate from glycocalyx reduces the overall adhesion of S-protein to HPAECs but exposes ACE2 receptors for binding. (a) Fluorescence staining of HS (red, left column) and ACE2 receptors (green, right column) performed for native (top row) and heparinase (Hase) treated HPAECs (bottom row). (b) Quantitative data of HS and ACE2 mean fluorescence intensity. (c,d) Fluorescent staining of ACE2 in siMock and siACE2-transfected HPAECs treated with heparinase. Representative pictures and quantitative data. (e,h) Histograms of adhesive parameters for native cells (grey) and heparinase treated cells (green). (f,i) Histograms of adhesive parameters for heparinase treated cells (green) and heparinase treated cells successively incubated with anti-ACE2. (g,j) Comparison of mean values. Left: plots for maximal detachment force. Right: plots for the number of rupture events. In all histograms and insets show selected spatially resolved maps (25 µm × 25 µm). Statistics: p values were determined by one-way ANOVA followed by Tukey’s post-hoc test. Experimental details are listed in Supplementary Table 1. Source data are provided as a Source Data file. HS heparan sulfate, Hase heparinase, anti-ACE2 ACE2 blocking antibody, Glx glycocalyx. Figure created with OriginPro2021 (https://www.originlab.com/2021), ImageJ 1.53e (https://imagej.nih.gov/ij/) and JPK Data Processing 6.1.79 (https://www.jpk.com/).

