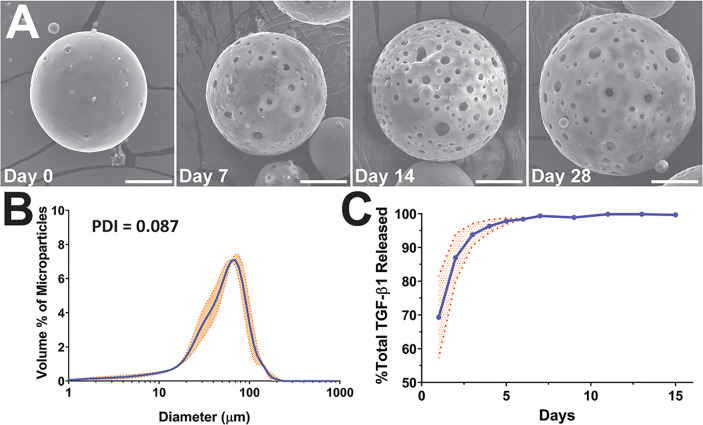
Figure 1.
Characterization of TGF-β1 PLGA microparticles (MPs). (A) Representative SEM images of the surface morphology of TGF-β1 PLGA MPs along with the releasing studies (collection time noted). Tests were performed twice independently with n = 5 per time point. Scale bar = 15 μm. (B) Size distribution and the calculated polydispersity index (PDI) of TGF-β1 PLGA MPs, as determined by laser diffraction. Data is the mean of three independent fabrication batches, measured in triplicates (N=3, n=9, blue line) with standard deviation (orange shade). (C) Release profile of TGF-β1 PLGA microparticles normalized to total protein release. Mean TGF-β1 release curve (blue line) was acquired by averaging four independent (N=4, n=13) studies with particles of different batches, with standard deviation (orange shade) as shown.

