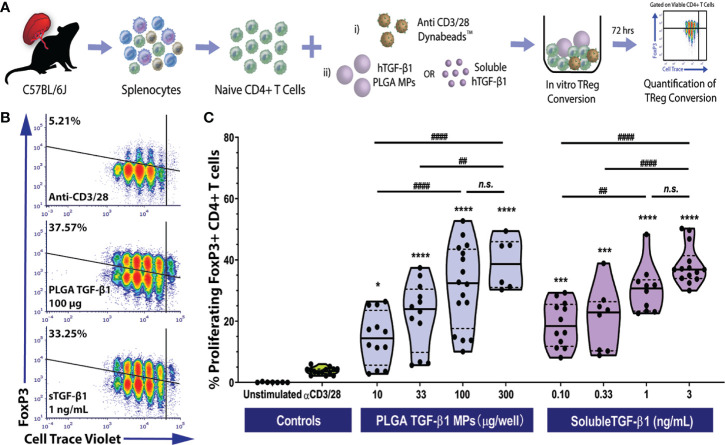
Figure 2.
Efficient Polyclonal Foxp3+ iTreg Conversion by PLGA Microparticles Releasing TGF-β1 In Vitro. (A) Schematic of polyclonal iTreg conversion assay. Conversion rate was assessed by flow cytometry analysis of Foxp3 expression after the three-day co-culture of 105 magnetically sorted splenic naïve C57BL/6 CD4+ T cells with anti-CD3/CD28 activator beads and TGF-β1, within either PLGA MPs or soluble format. (B) Representative flow cytometric density plots (gated on viable CD4+ T cells) showing the frequency of Foxp3+ induced Tregs resulting from polyclonal stimulation (anti-CD3/28) in the presence of PLGA TGF-β1 MPs or soluble TGF-β1. (C) Summary of polyclonal iTReg generation, characterized as the proliferating CD4+Foxp3+ cells (refer to Figure S3 ), following incubation with the designated agents. Data were shown in a truncated violin plot with the mean (solid black line) and individual data points (N=4; n=16). Paired Tukey’s test was conducted for mean comparison, with * used when compared to control group (activator beads only) and # for comparison within TGF-β1 groups. Statistical significance was determined as **** or ####p < 0.0001, ***p < 0.001, ** or ##p < 0.01, *p < 0.05 and n.s., not significant.

