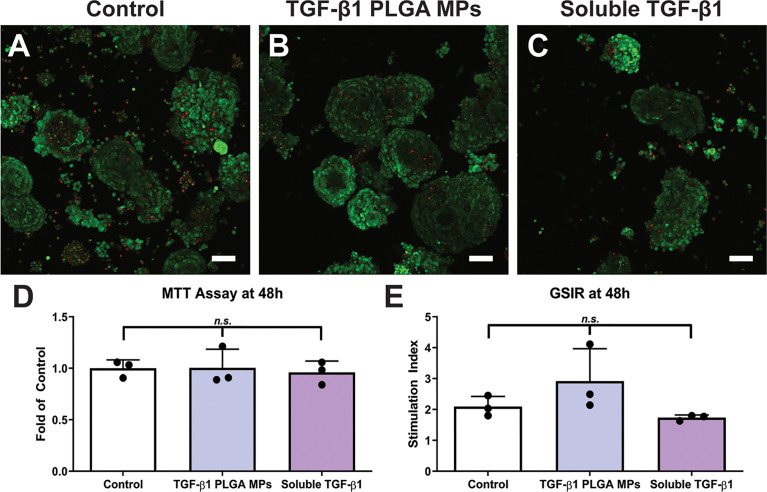
Figure 5.
Cytocompatibility of TGF-β1 PLGA Microparticles with Rat Pancreatic Islets. Representative LIVE/DEAD images of (A) control islets, (B) islets incubated with TGF-β1 PLGA microparticles, and (C) islets incubated with soluble TGF-β1. Red = dead cells (EthD-1), Green = viable cells (Calcein AM). Scale bars = 50 µm. (D) MTT metabolic assay, n=3. (E) Stimulation index resulted from glucose stimulated insulin response, High/Low 1, n=3. Paired Tukey’s test was conducted for mean comparison, with n.s., not significant.

