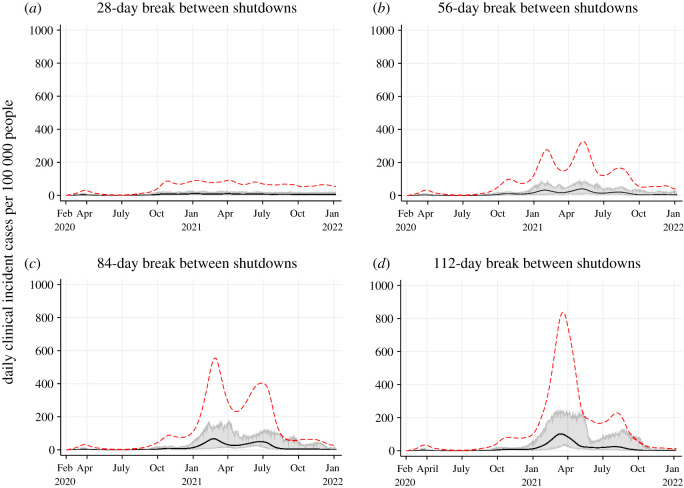
Figure 4.
Projected epidemic curves showing daily clinical incident cases per 100 000 people for Scenario 3 with different minimum breaks between shutdowns: 28-day break (a); 56-day break (b); 84-day break (c) and 112-day break (d). The black line represents the median clinical incident value across 50 model realizations. The shaded grey area represents the 95% credible interval. The red dash line represents the median of prevalent active clinical cases.

