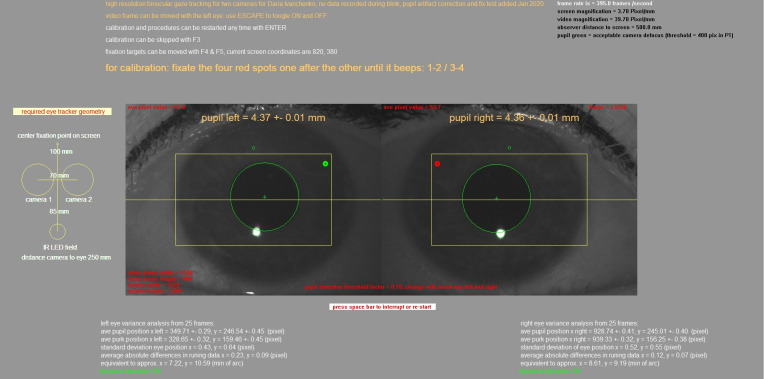
Figure 2.
Screenshot of the eye tracker software output, also showing the raw video images from both cameras. Large green circles mark the pupil borders, and small green circles (when visible) show the borders of the first Purkinje images. The yellow rectangles denote the areas in which the pupil is detected. The pixel coordinates of the pupil center, the pixel coordinates of the center of the first Purkinje images, and the standard deviations from 25 measurements are continuously displayed in the bottom. Note that standard deviations are below one pixel. Standard deviations are also provided in minutes of arc.

