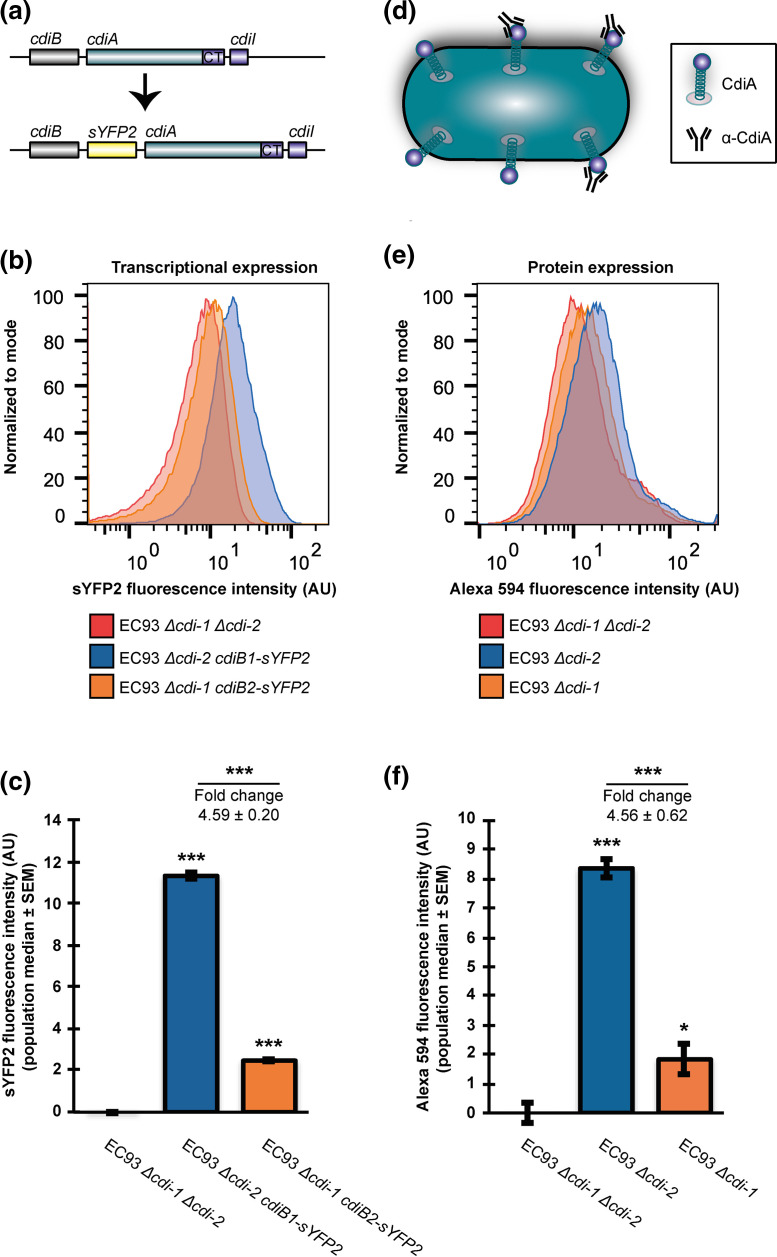
Fig. 5.
The cdi1 and cdi2 systems of EC93 are differentially expressed. (a) Schematic representation of the transcriptional reporter constructs used to measure cdi transcriptional activity. (b) Relative transcriptional activity of the cdi-1 and cdi-2 loci in EC93 determined by sYFP2 fluorescence (see Materials and Methods). (c) Quantification of the data presented in (b) (n=3 biological replicates ±sem). (d) Schematic representation of the immunofluorescence (IF) approach used to measure CdiA abundance on the surface of EC93. (e) Relative CdiA surface abundance on EC93 cells (see Materials and Methods). (f) Quantification of the data presented in (e) (n=3 biological replicates ±sem). Statistical significance was determined by two-tailed, unpaired t-test (*P<0.05, **P<0.005, ***P<0.0005).

