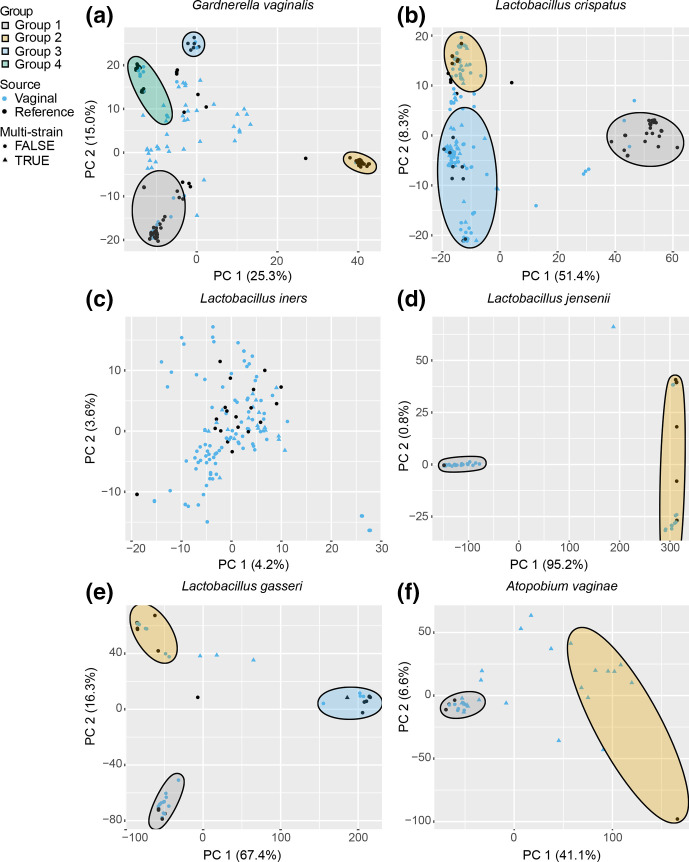
Fig. 2.
PCA of SNP data for (a) G. vaginalis , (b) L. crispatus , (c) L. iners , (d) L. jensenii , (e) L. gasseri and (f) A. vaginae . Each vaginal sample and reference strain is shown by their PC1 and PC2 coordinates. Vaginal samples are indicated by blue points and reference strains are indicated by black points. Samples that were identified as multi-strain are represented by triangles and single-strain samples are represented by circles. Subpopulation groups were determined by ADMIXTURE analysis and ellipses drawn to show vaginal samples and reference strains belonging to a single group.

