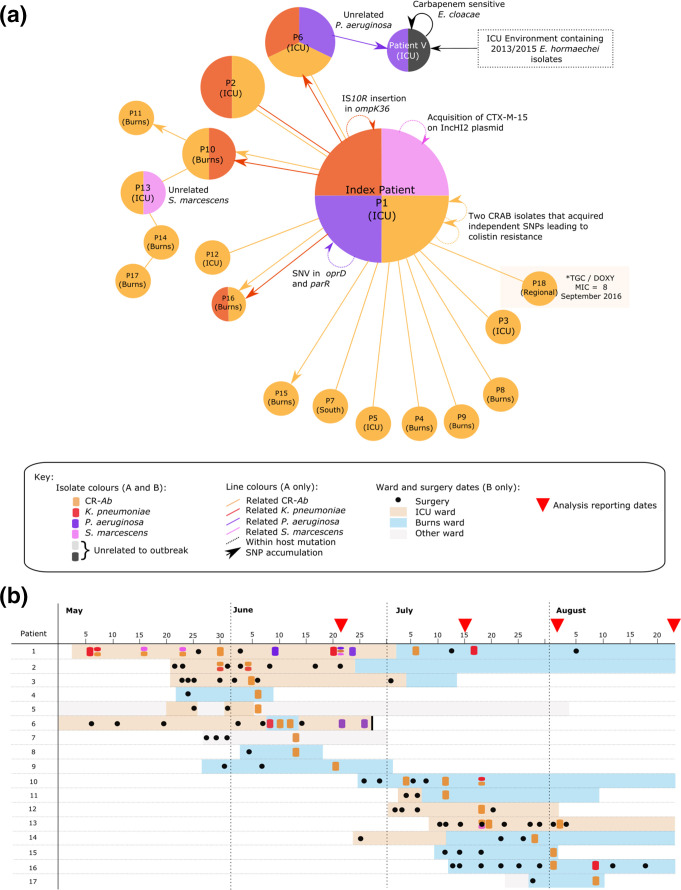
Fig. 1.
Patient relationship matrix describing 2016 outbreak of CR-Ab: (a) Each circle represents a patient, where the size of the circle correlates to the number of isolates from that patient. Colours correspond to bacterial species. Straight lines connecting circles represent patients with identical isolates (with the colour of the line indicating the specific species) at the core-genome level (and as such directionality of transmission cannot be inferred). Lines with arrows (also coloured by species) represent predicted direction of transmission based on the accumulation of SNPs between patients’ isolates. Circular arrows represent changes in individual patient’s isolates, (b) timeline of patient samples, as well as location and surgery dates.

