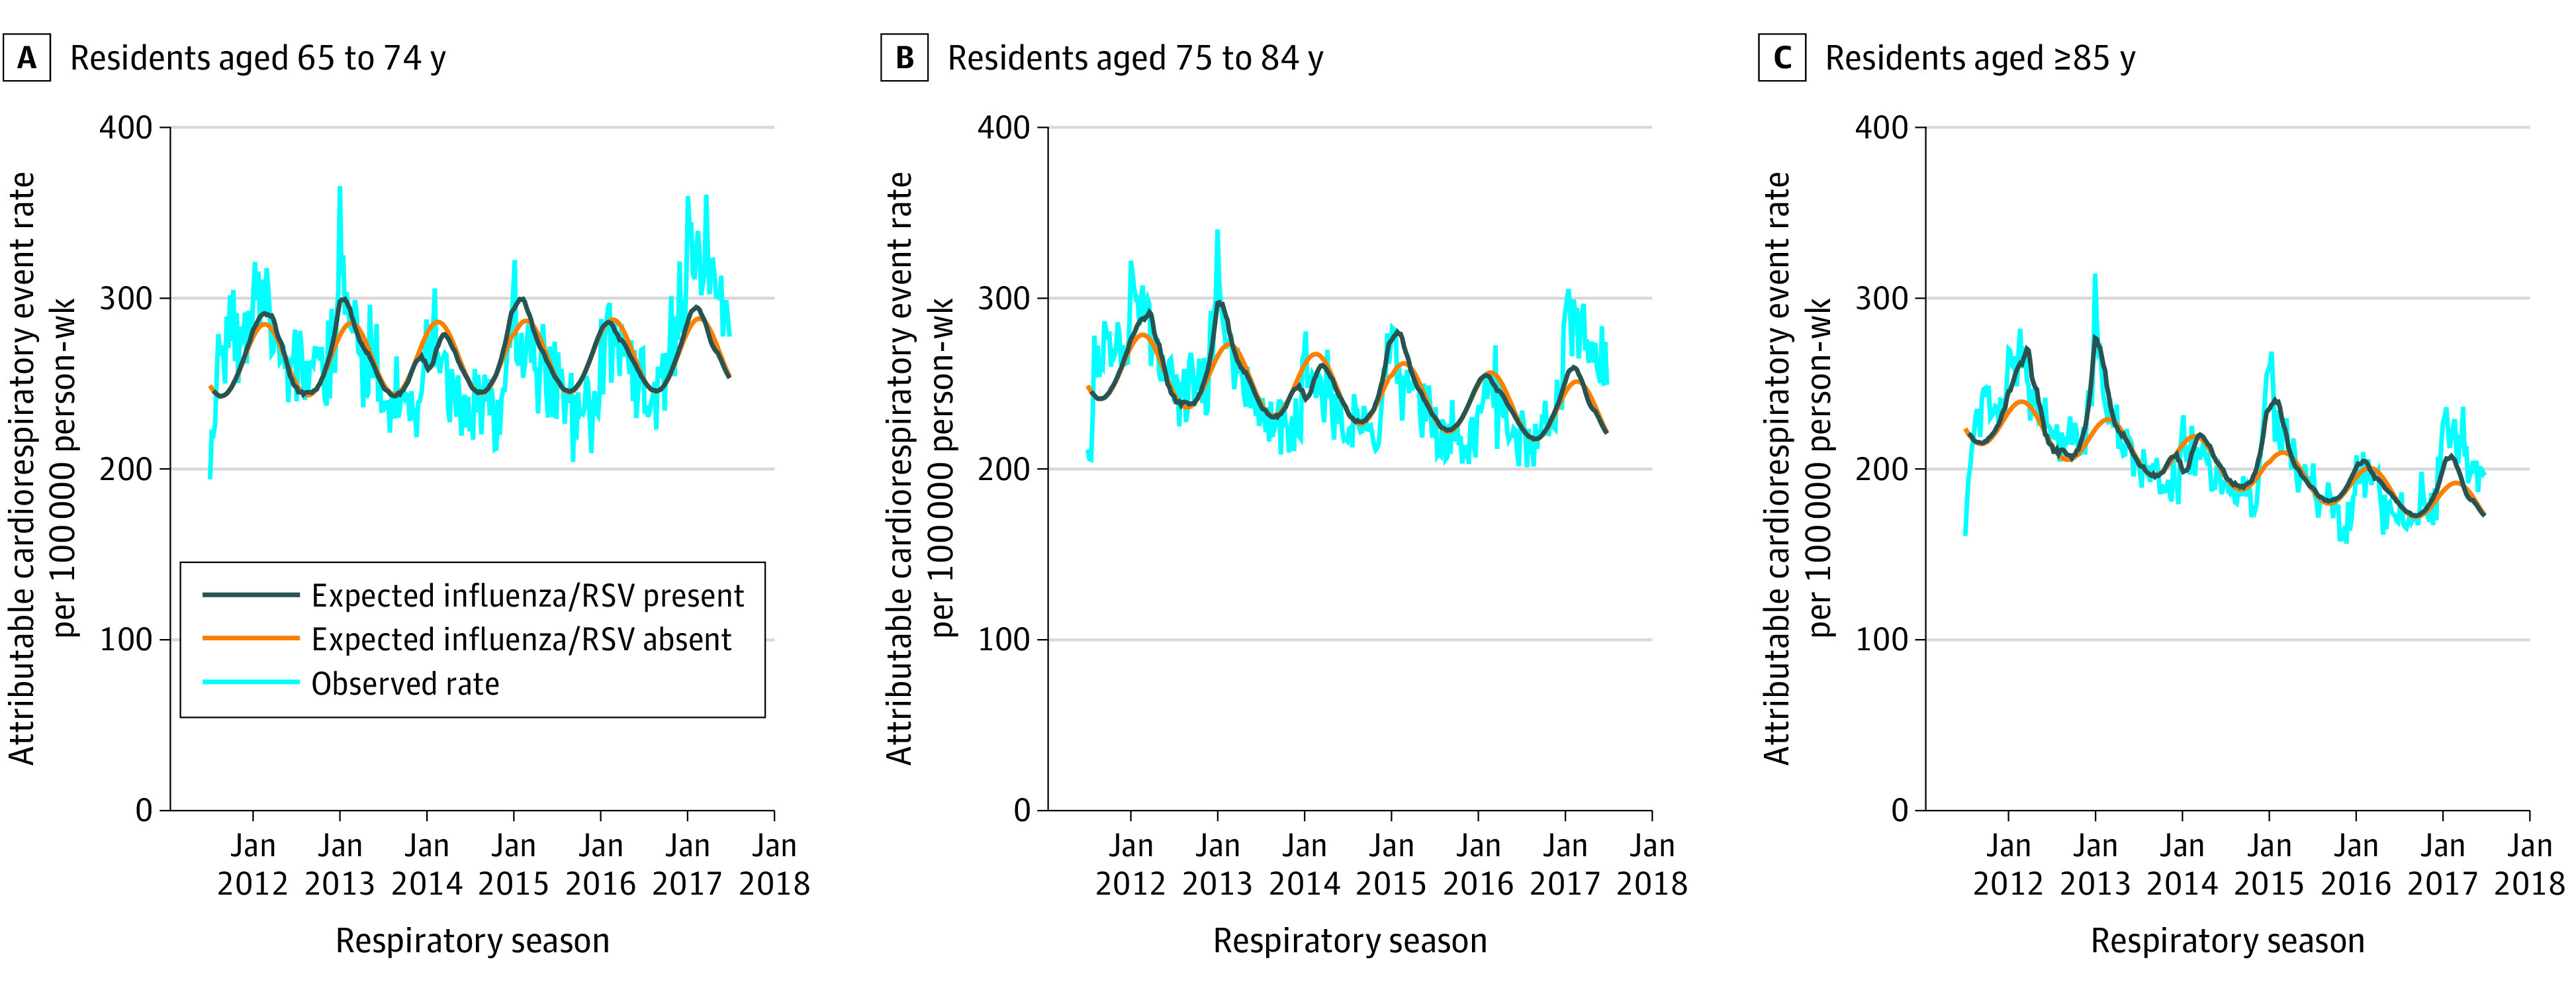
Figure. Weekly Observed and Model-Estimated Cardiorespiratory Hospitalization Rates Among Long-term Care Facility (LTCF) Residents Between 2011 and 2017.

The light blue line represents the observed cardiorespiratory hospitalizations per 100 000 person-weeks during a given week. The dark blue line represents the expected cardiorespiratory hospitalizations per 100 000 person-weeks when influenza and respiratory syncytial virus (RSV) are present. The orange line represents the expected cardiorespiratory hospitalization per 100 000 person-weeks when influenza and RSV are not circulating (ie, the viral terms are set to 0). The difference between the orange and blue lines represents the influenza- and RSV-attributable cardiorespiratory hospitalizations among LTCF residents. Weeks with the dark blue line above the orange line represent positive (ie, greater than 0) attributable hospitalization estimates, whereas weeks with the dark blue line below the orange line represent negative (ie, less than 0) attributable hospitalization estimates.
