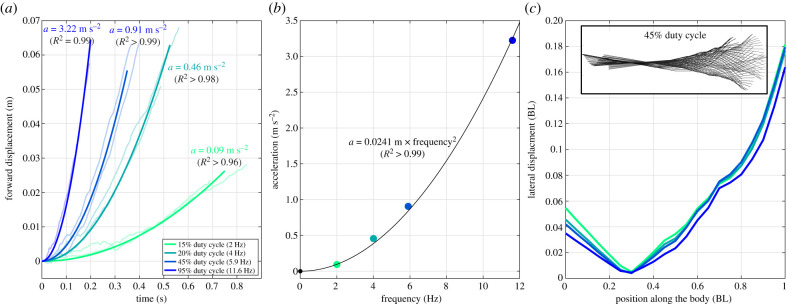
Figure 3.
Acceleration performance and body kinematics. (a) Forward displacement over time for different flapping frequencies. Faint lines indicate raw data of the different runs, bold lines show average of regressed models of constant acceleration. (b) Mean accelerations for different frequencies show a quadratic relationship. (c) Body amplitude (i.e. lateral displacement) with respect to position along the body's midline. The black and white inset illustrates the midline kinematics of a representative trial. Coloured lines and points correspond to the four different duty cycles, and hence accelerations, studied. (Online version in colour.)

