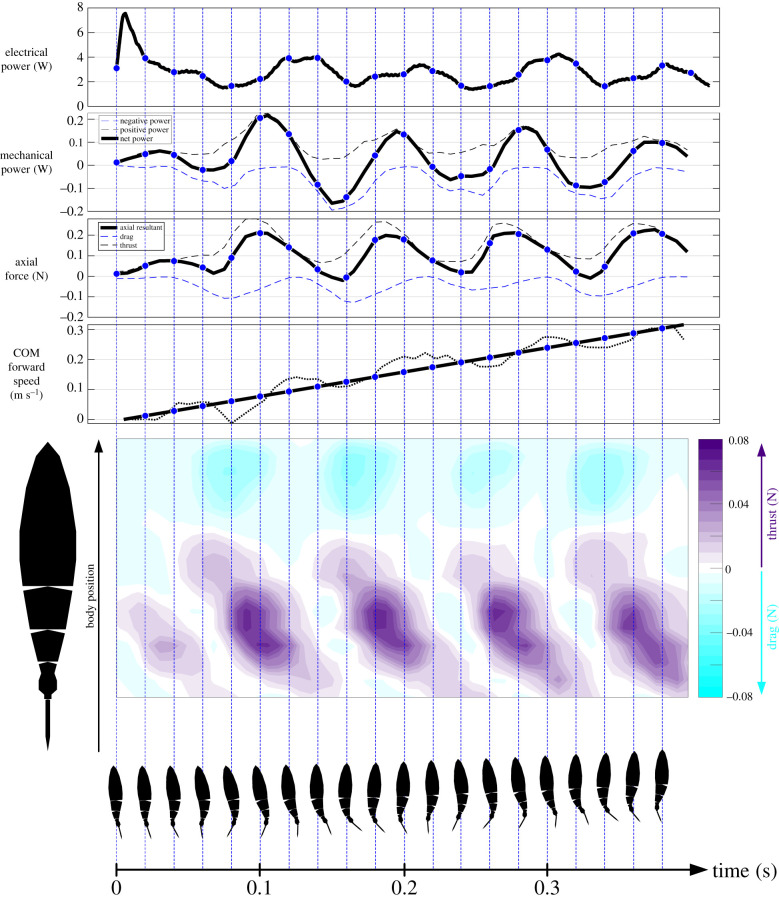
Figure 5.
Power and thrust forces during an acceleration manoeuvre (45% duty cycle, 5.9 Hz tail beat frequency). The four graphs at the top indicate the electrical power input to the robot, mechanical power output to the fluid (excl. caudal fin), axial forces generated (excl. caudal fin) and the centre of mass (COM) forward speed during this representative acceleration from rest. The blue dots and vertical dashed lines denote the same time instance in all graphs indicated by the body images below. The initial rapid increase in power is evident within the first 6 ms, followed by power oscillations starting at around 150 ms. Dashed lines on the mechanical power graph indicate positive (black) and negative (blue) power, where positive power corresponds to the work done by the body on the fluid per time and negative power vice versa. Similar figures for all trials and frequencies are provided in the electronic supplementary material. (Online version in colour.)

